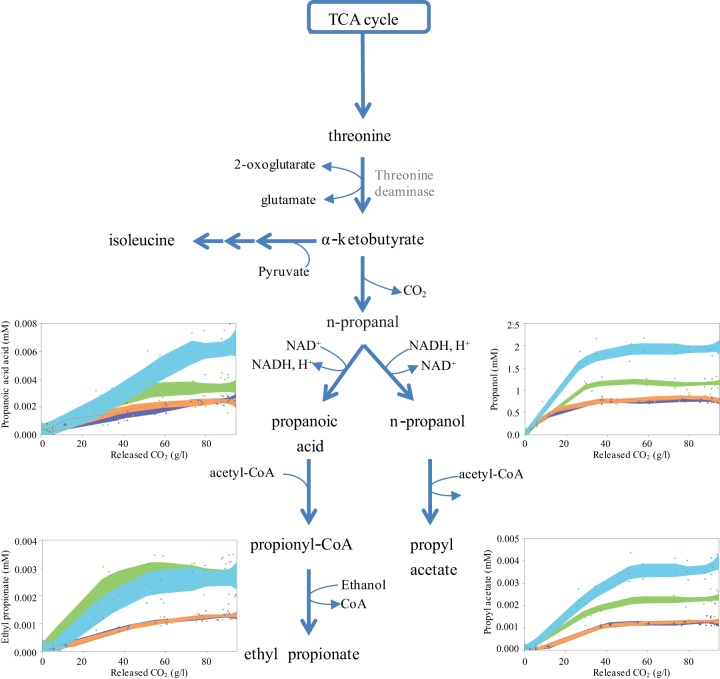
FIG 2.
Concentrations of propanol, propanoic acid, and corresponding esters following changes in the NAD(P)H demand. The values represent the averages of three biological replicates. The metabolite concentrations obtained with the 59-NADH-Bdh strain in the presence of 200 mM acetoin (blue) or 0 mM acetoin (orange) and with the 59A-NADPH-Bdh strain in the presence of 200 mM acetoin (green) or 0 mM acetoin (violet) are shown.

