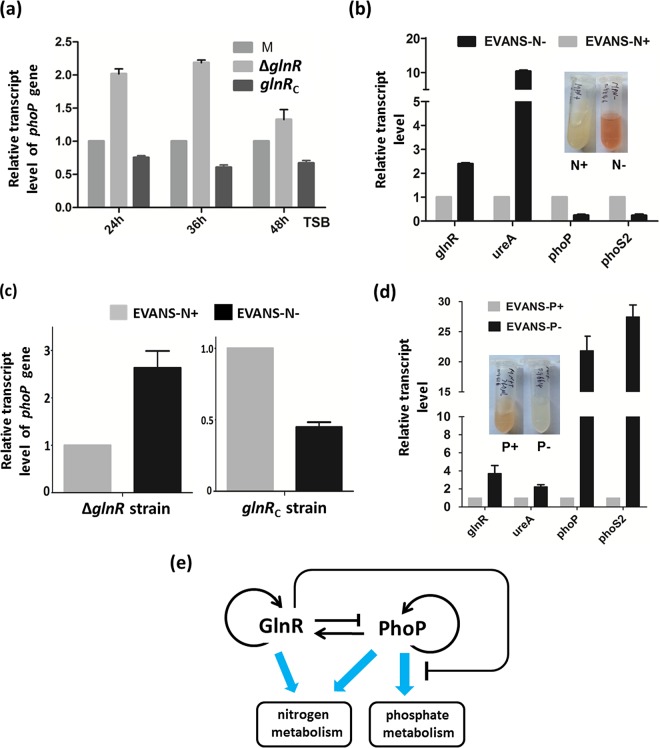
FIG 6.
Transcription levels of genes involved in nitrogen/phosphate metabolism in response to nutrient availability. (a) Differences in phoP transcription between the wild-type, ΔglnR, and glnRC strains in TSB medium. RNAs were extracted from S. erythraea NRRL2338 and the ΔglnR and glnRC strains grown in TSB at 24 h, 36 h, and 48 h. Results were normalized to 16S rRNA levels. (b) Transcription profiles of genes (glnR, ureA, phoP, and phoS2) under nitrogen-rich conditions (i.e., in Evans medium with 30 mM glutamine [Evans-N+]) or nitrogen-limited conditions (i.e., in Evans with 2 mM glutamine [Evans-N−]). (c) Transcription profiles of phoP in ΔglnR and glnRC strains in Evans-N+ or Evans-N−. (d) Transcription profiles of genes (glnR, ureA, phoP, and phoS2) under phosphate-rich conditions (i.e., in Evans medium with 10 mM K2HPO4 [Evans-P+]) or phosphate-limited conditions (i.e., in Evans medium with 40 μM K2HPO4 [Evans-P−]). Fold changes represent gene expression levels in Evans-N+ or -P+ relative to the expression levels observed in Evans-N− or -P−. Data are means and standard deviations from three independent experiments, each with triplicate samples, using distinct cDNA preparations for each RNA sample. (e) The PhoP-GlnR regulatory circuit, which includes a positive and a negative interaction.

