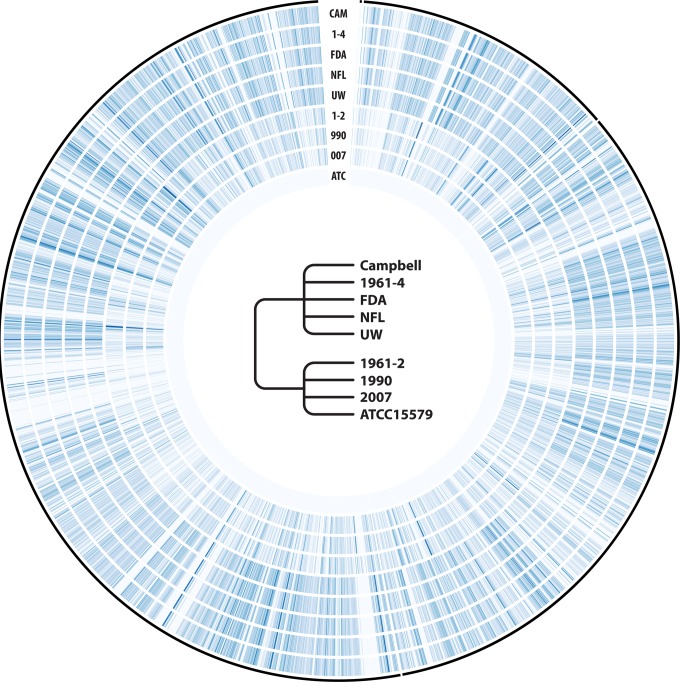
FIG 3.
Single nucleotide polymorphism (SNP) profiling of the sequenced Clostridium sporogenes strains against the ATCC 15579 reference genome (GenBank accession number NZ_ABKW00000000.2). The four C. sporogenes contigs in the ATCC 15579 reference accessions are represented by the outer thin black lines. SNP densities (SNPs per kilobase pair) in the inner concentric heatmaps are color coded according to a bluish gradient (lightest for 0, darkest for 200; the maximum observed was 194 SNPs/kbp). All regions are drawn to scale. The cladogram in the center illustrates the relationships inferred between the various strains from our 16S rRNA gene maximum likelihood tree.

