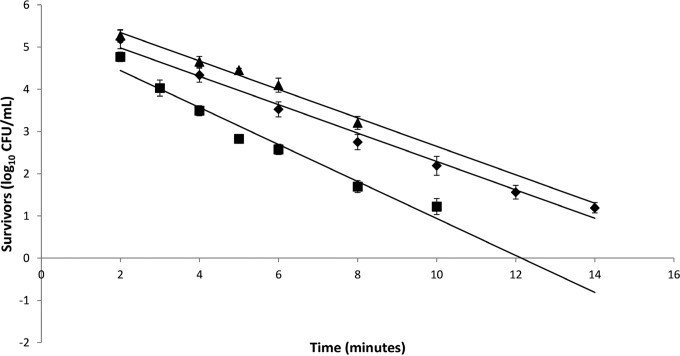
FIG 4.
Survival curve of C. sporogenes strains ATCC 7955 NCA3679 1961-2 (◆) and 2007 (■) and PA 3679 FDA (▲). D-values were calculated from the negative reciprocal of the slopes of the regression lines. Data for the survival curves were generated by heat treatment at 97°C (isolate 1961-2), 100°C (isolate 2007), and 117°C (isolate FDA).

