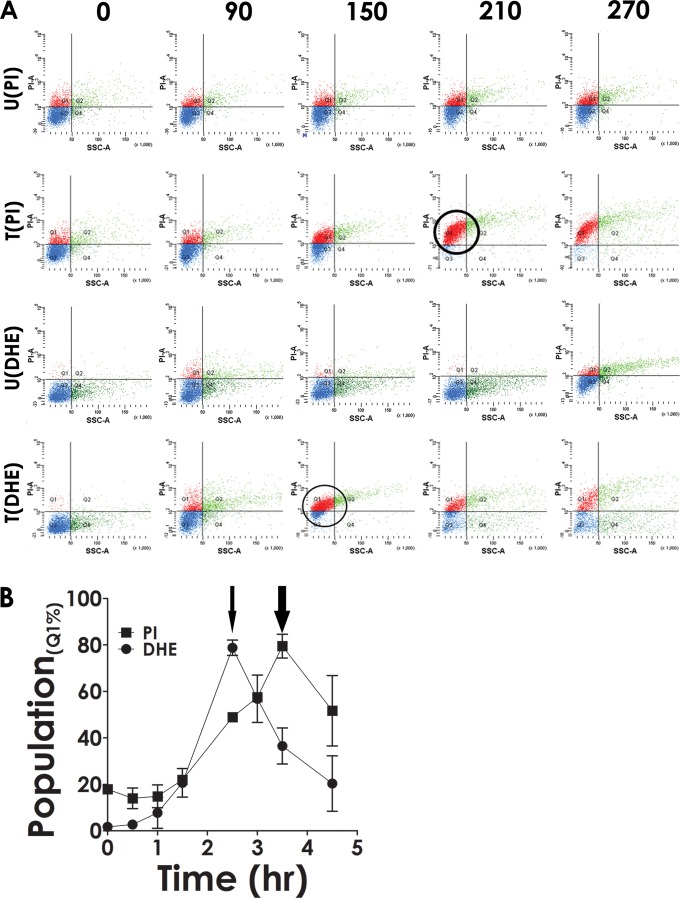
FIG 5.
Superoxide generation associated with phage growth. (A) Cell death and generation of superoxide were monitored at different stages of phage growth using PI and DHE as indicated. The cells were either treated with phage (T) or left untreated (U). The images are described as U(PI), T(PI), U(DHE), and T(DHE) depending on their treatment status. The numbers in boldface at the top indicate the time points, in minutes, at which monitoring was done. Thick (PI) and thin (DHE) circles highlight the presence of the maximum number of cells in the Q1 quadrant (highly stained population). (B) The experiment was repeated three times, and the mean population density ± standard deviation was plotted against time. Thick (PI) and thin (DHE) arrows point to the stage where maximum Q1 population density was achieved during the course of the experiment.

