
FIG 2.
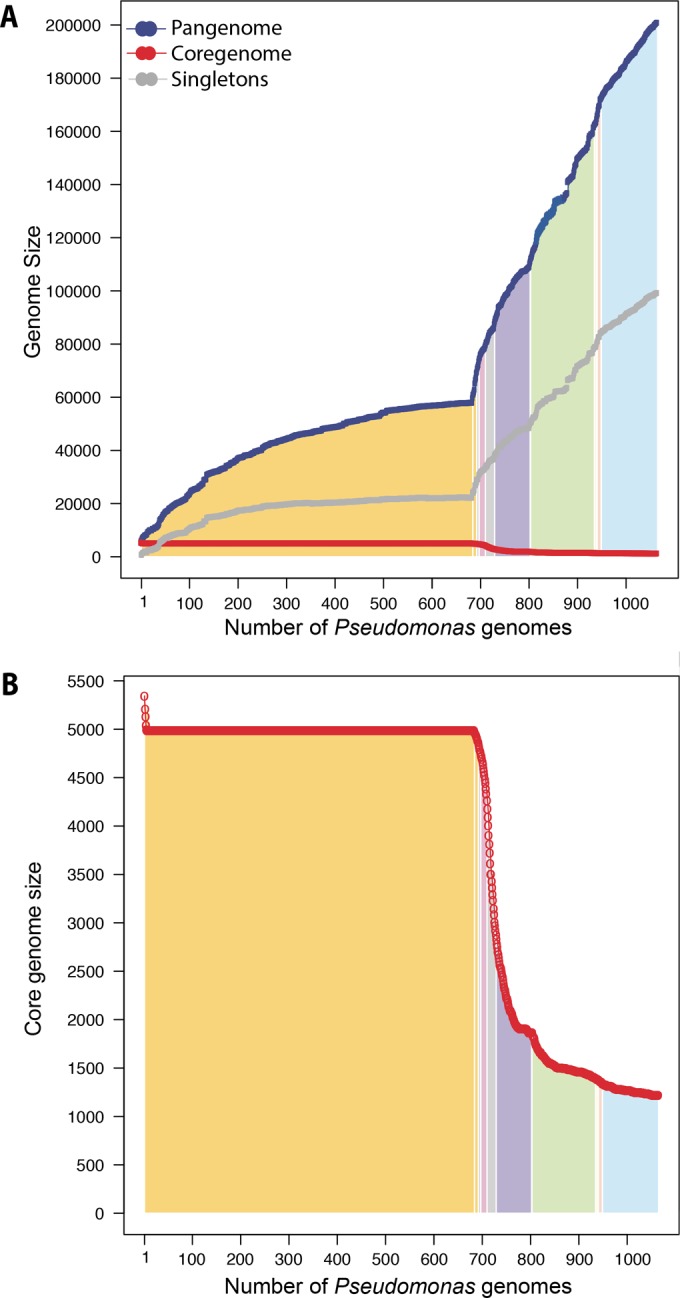
Pangenome, core genome, and singleton genome analyses. (A) Accumulative pangenomes (blue), core genomes (red), and singleton genomes (gray) when Pseudomonas isolates were added in the order of their positions on the AAI tree in Fig. 1, starting with genomes from the node labeled “cluster 53 P. aeruginosa.” The color-coded areas correspond to the major groups defined in Fig. 1. (B) The core genome of panel A plotted on a zoomed scale.