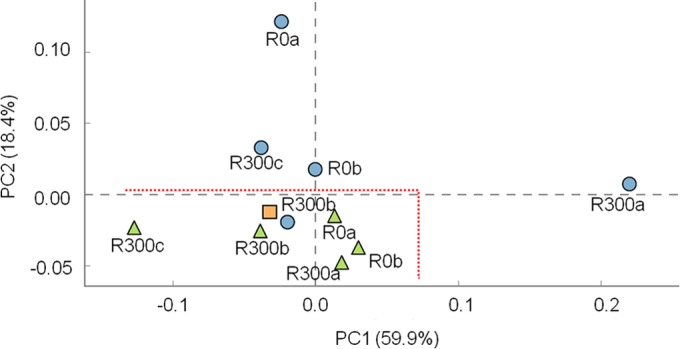
FIG 5.

Principal component analysis on Hellinger-transformed data of family relative abundance calculated for microbial communities enriched at the anodes, in the bulk anolyte of reactors polarized at 0 mV and +300 mV (versus an Ag/AgCl [3 M KCl] reference electrode), and in the start-up sediment used as the inoculum. (Blue circles denote samples collected from the anodes, orange square denotes microbial inoculum, and green triangles denote samples collected from the bulk anolyte in the reactors at the end of the treatment.) The microbial communities enriched on the anodes and in the bulk anolyte formed separate groups.
