
FIG 5.
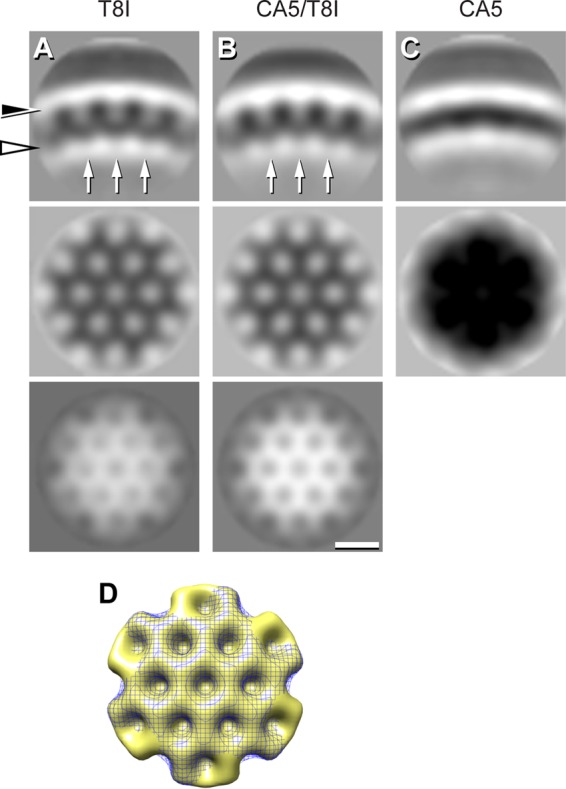
Subtomogram averaging of the CA-SP1 inner shell of density. (A to C) Sections through the three-dimensional (3D) maps. Top row, radial sections; central row, in-plane section at the height of CA (black arrowhead); bottom row, in-plane section at the height of SP1 from the immature-like shells (white arrowhead). The arrows in the top panels label the faint densities corresponding to SP1. To enhance the signal from the CA-SP1 layer, the viral membrane and MA layer were not used during subtomogram aligning and classification; as a result, they are not resolved in the final average. This suggests that the distance between the CA-SP1 shell and the MA is not constant, in agreement with the fact that cleavage between MA and CA has taken place. Scale bar, 10 nm. (D) Top view of surface renderings of the CA-SP1 lattices of CA5/T8I (gold, solid) and of T8I (blue, mesh). To compare with the CA-SP1 lattice from WT protease-defective virions, the reader is referred to two studies by Keller et al. (11, 15).