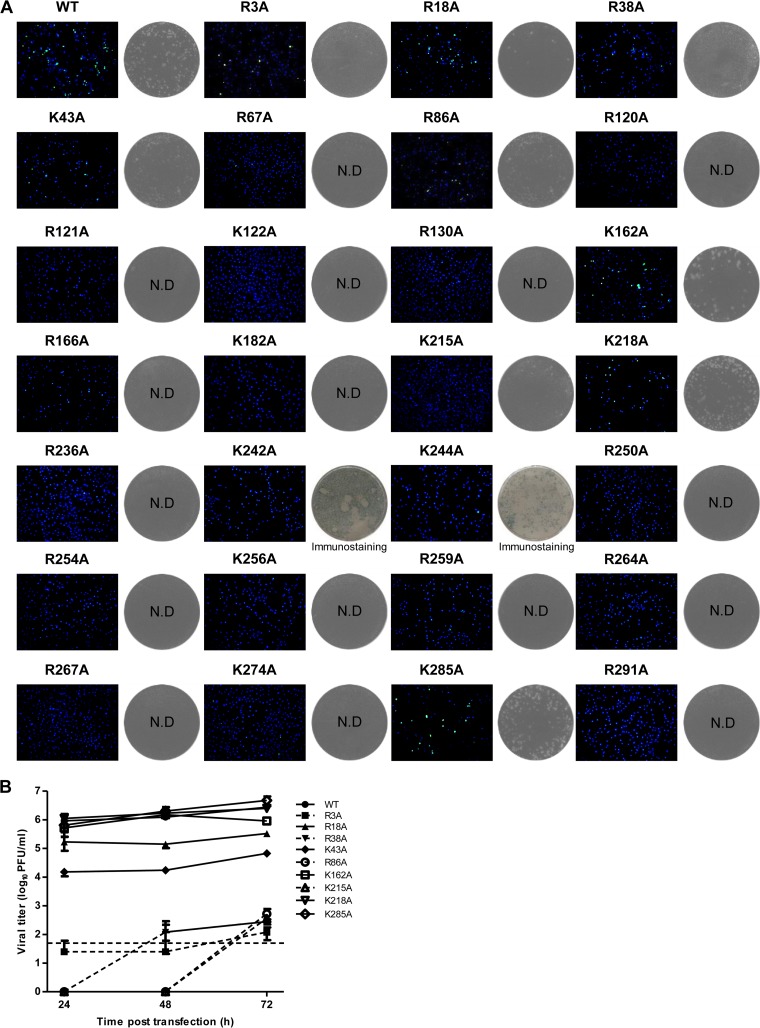
FIG 2.
Analysis of EV71 VP1 charged-to-alanine scanning mutants. (A) Analysis of IFA and plaque morphology for each mutant. Vero cells were transfected with WT and mutant genome-length RNAs (10 μg) and analyzed by IFA at 48 h posttransfection (left panels for each virus). For each IFA, anti-EV71 monoclonal antibody (MAB979) and goat anti-mouse IgG conjugated with Alexa Fluor 488 were used as primary and secondary antibodies, respectively. The cell nucleus was stained with DAPI (4′,6-diamidino-2-phenylindole) and is presented in blue, the positive signal of EV71 is presented in green, and results from one representative experiment of three independent experiments is shown. Plaque morphologies of WT and mutant viruses are shown in the right panels for each virus. N.D., not detectable by either plaque assay or infectious center assay. (B) Virus release of EV71 mutants after transfection. Viruses from culture supernatants were collected every 24 h after transfection. Viral titers were determined by plaque assay on Vero cells. Error bars indicate the standard deviations from three independent experiments; the dashed line represents the limit of sensitivity of the plaque assay.

