FIG 3.
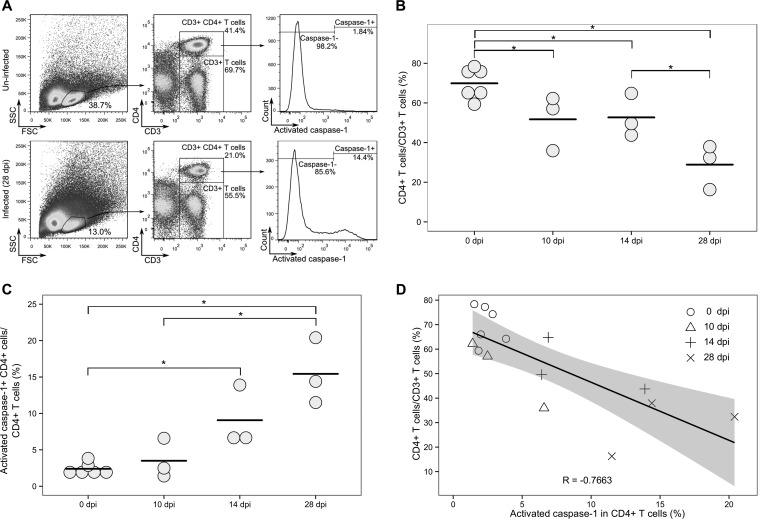
CD4+ T cell pyroptosis correlates with decline of CD4+ T cells assessed using flow cytometry. (A) Representative results of CD4+ T cells expressing active caspase-1 protein in dLNs of uninfected macaques and macaques 28 dpi. FSC, forward scatter: SSC, side scatter. (B) Decrease of CD4+ T cells in dLNs after SIV infection. (C) Increase of CD4+ T cells expressing activated caspases-1 in dLNs after SIV inoculation. In panels B and C, each symbol represents the value for an individual macaque, and each bar shows the average value for the group of macaques. Mean values that are significantly different (P ≤ 0.05) are indicated by a bar and asterisk. (D) Correlation analysis of CD4+ T cells expressing activated caspase-1 and the levels of CD4+ T cells.

