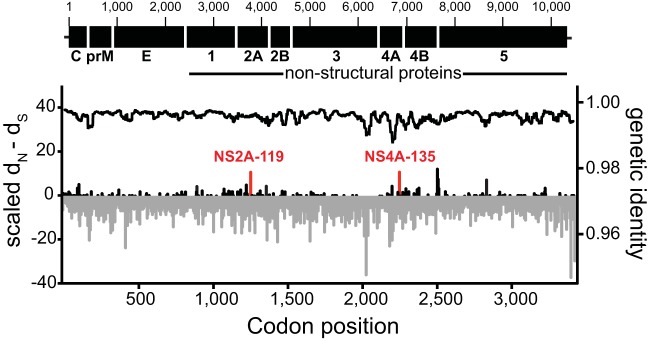
FIG 3.
Genetic variability across the WNV genome. The graph shows the value of dN − dS (left y axis; estimated by the SLAC method) for each codon across the WNV coding sequence (displayed in the top panel). Negative values for dN − dS are shown in gray, and positive values are shown in black. Sites that show consistent evidence for positive selection based on the SLAC, FUBAR, and MEME methods are marked in red. The black line on top (right x axis) indicates the average nucleotide identity estimated as the average value across 100 nucleotides, using a sliding window of 5-nucleotide steps.

