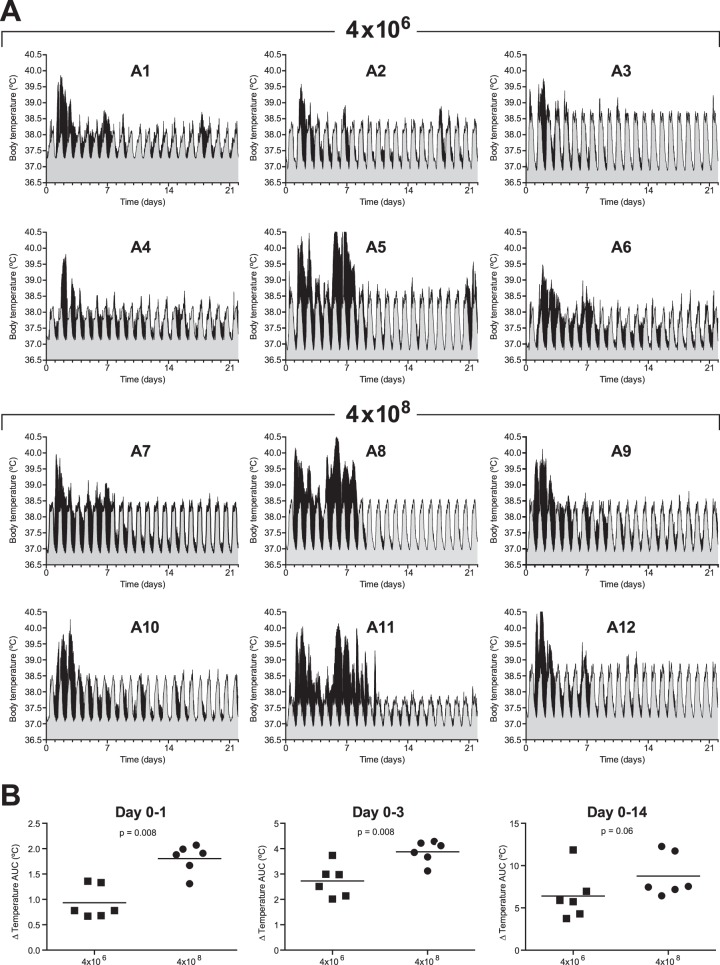
FIG 2.
Body temperature of individual animals after low- and high-dose Mex4487 influenza virus inoculation. (A) Shown in black is the actually recorded temperature over time after infection for each individual animal. These temperatures are plotted on top of the circadian temperature pattern recorded before infection (gray area). The circadian pattern was calculated from the temperatures recorded during 3 weeks before infection. Gray areas represent the mean temperatures with the 95% confidence intervals. Animals 1 to 6 (A1 to A6) received a low-dose challenge (4 × 10⁶ TCID50), and animals 7 to 12 (A7 to A12) received a high-dose challenge (4 × 10⁸ TCID50). (B) Cumulative temperature increase, calculated as the AUC from the actually recorded temperature after infection, minus the mean circadian temperature pattern and the upper level of the 95% confidence interval recorded before infection during 1 day, 3 days, or 14 days after infection. Squares represent animals 1 to 6 (4 × 10⁶ TCID50), and circles represent animals 7 to 12 (4 × 10⁸ TCID50). Statistical differences between groups were determined with the Mann-Whitney test.

