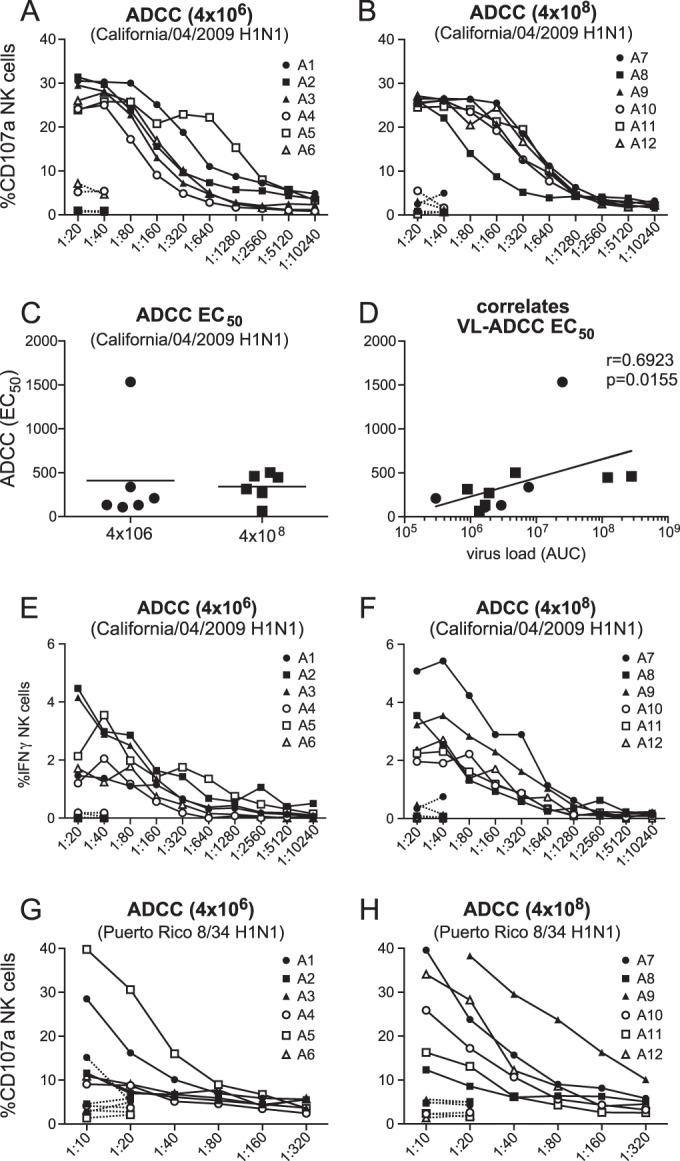
FIG 7.

ADCC measured in serum of cynomolgus macaques after low- or high-dose Mex4487 influenza virus inoculation. The graphs show induction of CD107a IFN-γ expression in NK cells after incubation on HA-coated plates in the presence of different dilutions of serum collected before (dotted lines) or 8 weeks after (solid lines) virus inoculation. (A and B) Percentages of NK cells expressing CD107a after incubation with serum from animals in the low-dose (4 × 10⁶ TCID50) and high-dose (4 × 10⁸ TCID50) groups, respectively, measured on wells coated with HA from influenza A California/04/2009. (C and D) EC50s in the low- versus high-dose group (C) and EC50s plotted against cumulative virus load (AUC) in tracheal swabs, measured on wells coated with HA from influenza virus A California/04/2009 (D). Filled circles are results for the low-dose group, and filled squares are results for the high-dose group animals. (E and F) Percentage of NK cells expressing IFN-γ after incubation with serum from animals in the low-dose (4 × 10⁶ TCID50) (E) and high-dose (4 × 10⁸ TCID50) (F) groups, measured on wells coated with HA from influenza A California/04/2009. (G and H) Percentage of NK cells expressing CD107a after incubation with serum from animals in the low-dose (4 × 10⁶ TCID50) and high-dose (4 × 10⁸ TCID50) groups, measured on wells coated with HA from influenza virus A/Puerto Rico/8/34. A1 to A12, animals 1 to 12. Correlation with virus load was calculated by using the Spearman correlation test. The black line represents interpolated data, as a semilog standard curve.
