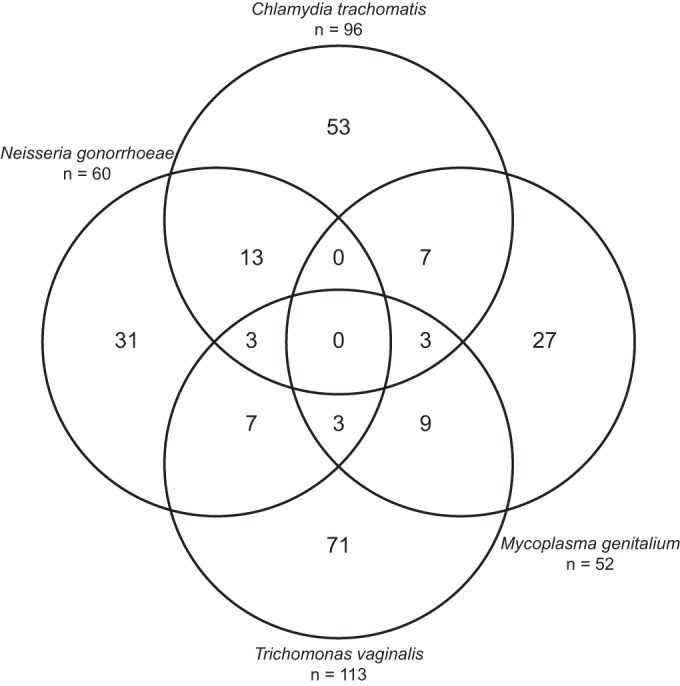
FIG 1.

Venn diagram of multiple genital infections. Note that the double infections of Chlamydia trachomatis with Trichomonas vaginalis (n = 17) and Neisseria gonorrhoeae with Mycoplasma genitalium (n = 3) are not represented in the figure. The number of infections in each circle equals the total amount (n) given.
