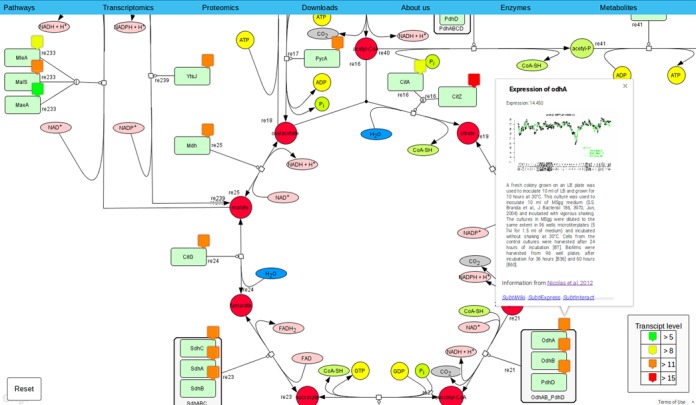
Figure 3.

Pathway presentation in SubtiPathways. This application is based on the Google Maps API to generate interactive maps. On the page the user is able to project transcriptomic or proteomic data onto the maps. This results in the appearance of interactive, color-coded markers which give access to information boxes.
