Figure 4.

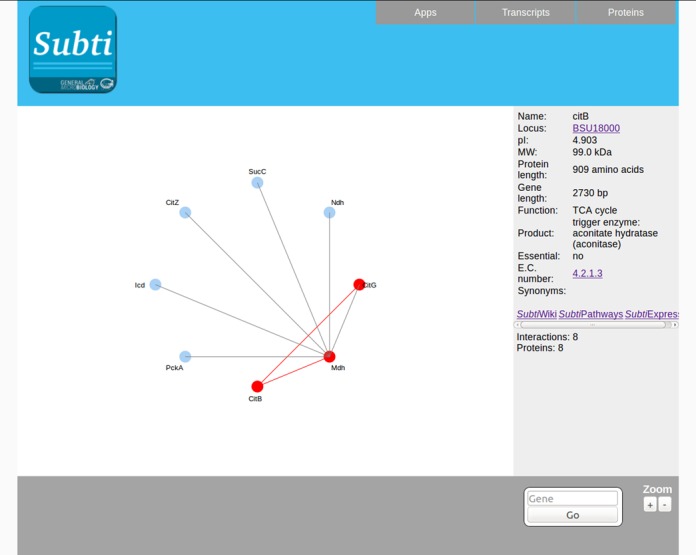
Interaction presentations in SubtInteract. SubtInteract visualizes the manually curated protein–protein interactions. The user can change the zoom level, and project transcriptomic and proteomic data on the interactive image.

Interaction presentations in SubtInteract. SubtInteract visualizes the manually curated protein–protein interactions. The user can change the zoom level, and project transcriptomic and proteomic data on the interactive image.