
Figure 5.
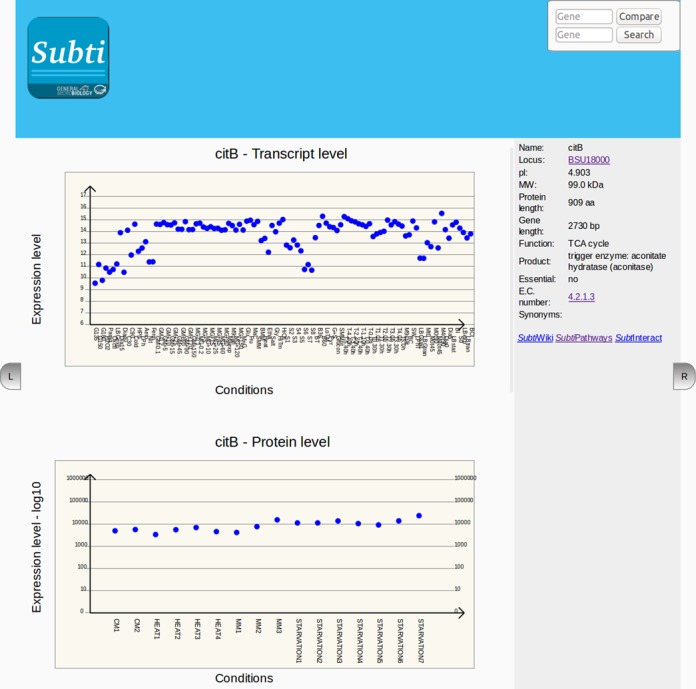
Presentation of expression data in SubtiExpress. This application provides information on gene expression levels, protein quantities as well as the transcriptional organization of the genomic region of the gene. The user can interactively explore the conditions used in the diagram and compare expression levels of the gene/protein of interest with other genes/proteins.