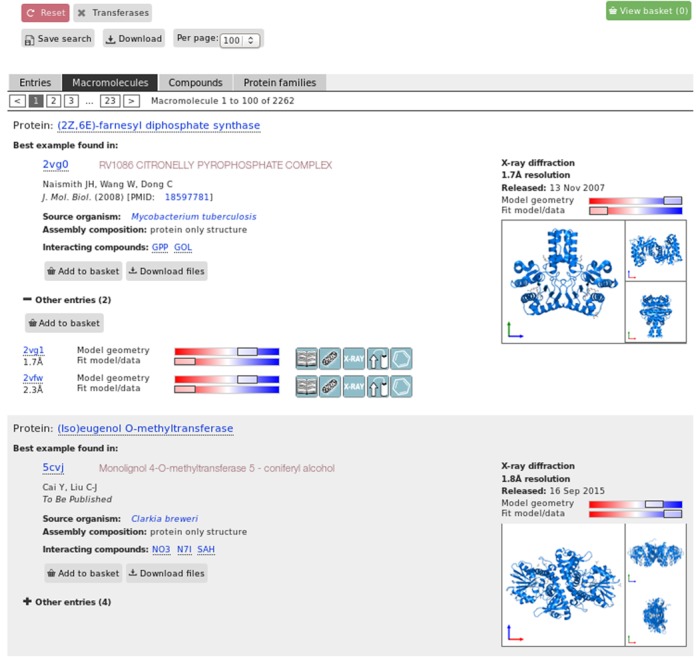
Figure 4.

The ‘macromolecule’ view of the query interface. The results show the number of unique macromolecules (in this case 2262) present in the result set for the query ‘transferases’. A representative (or ‘best’) structure for each unique macromolecule is shown, with an image gallery highlighting the location of the particular macromolecule within the assembly. Other instances of this macromolecule in PDB entries are listed below. This is in addition to the traditional result interface which lists all the PDB entries that satisfy the given query criterion (≈18000 individual PDB entries in this case).
