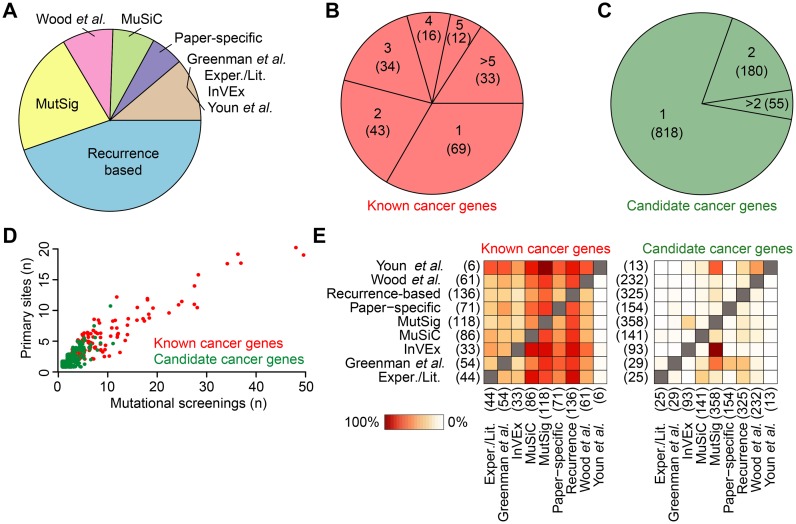
Figure 2.
Overview of data in NCG 5.0: (A) Cancer mutational screenings divided according to the method that was applied to identify cancer genes in the original publication. Methods and corresponding screenings are described in Supplementary Table S1. (B–C) Fractions of known and candidate cancer genes supported by one or more methods. Gene counts are reported in brackets. (D) Number of mutational screenings and primary sites where each cancer gene has been reported as a driver. TP53 is an outlier and has been excluded from the analysis because it has been identified in 113 screenings across 22 primary sites. (E) Heatmaps of the overlap between methods identifying known and candidate cancer genes. Each box represents the percentage of cancer genes identified with one method that are also supported by another. For each method, the total number of associated cancer genes is reported in brackets.

