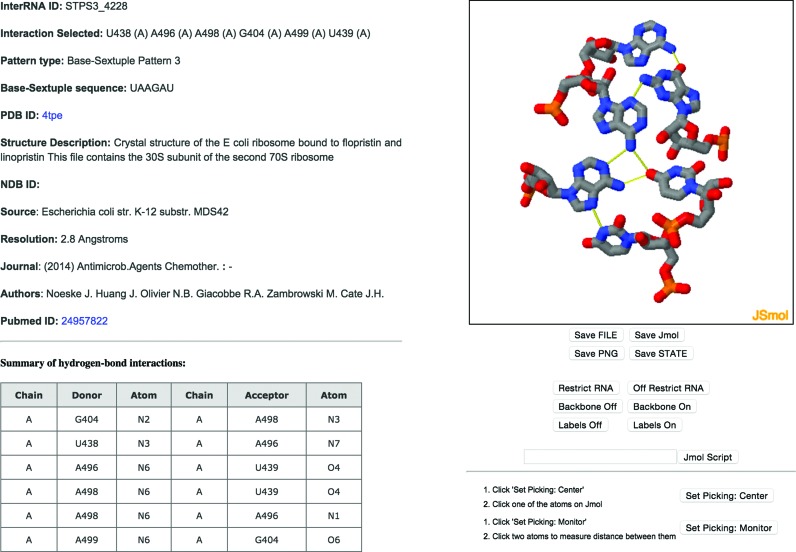
Figure 2.
Example of the user interface displaying an InterRNA database record; the JSMol panel enables browser embedded molecular visualization of the entry which in this example is a sextuple type 3 pattern in a generally planar arrangement. A summary of the hydrogen bonds involved in the interaction is also provided in the lower left panel.

