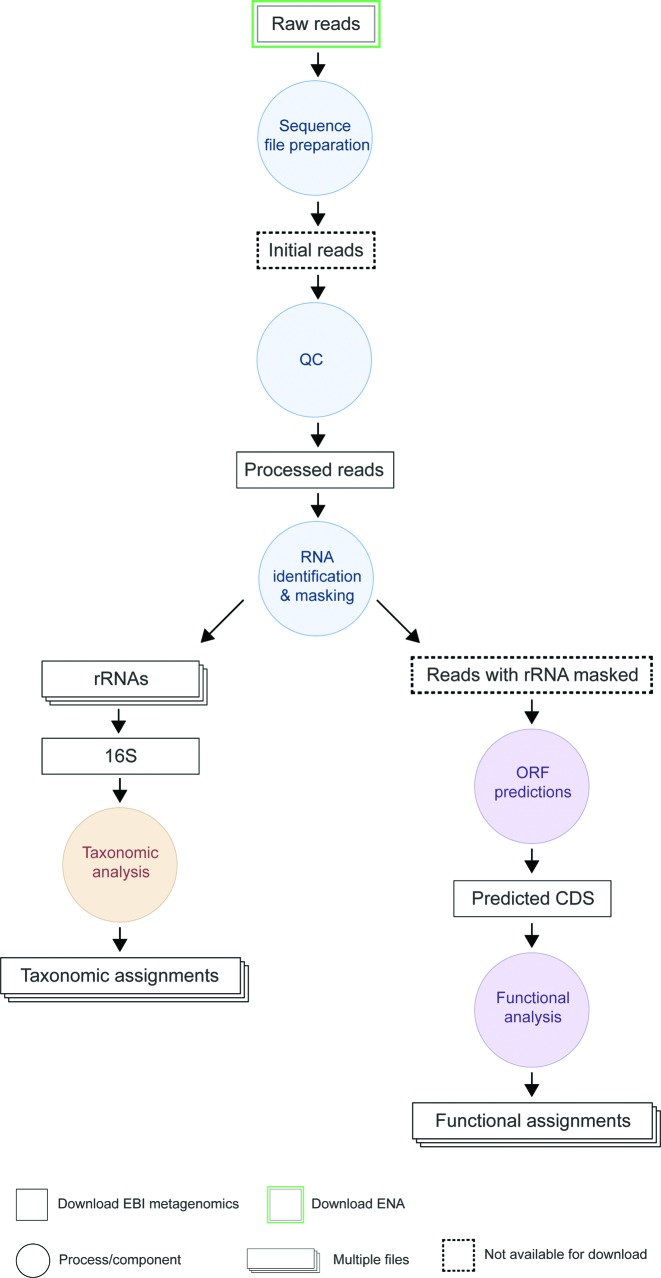
Figure 1.
Schematic of the analysis pipeline. Processes/components are indicated as circles and inputs/outputs are represented by rectangles. The structure of pipeline v2.0 is similar to that of v1.0. Following input file preparation and a QC stage (to remove short/low quality reads), the pipeline branches into two parts: one performing taxonomic classification (based on 16S rRNA) and the other providing functional annotation (based on pCDS matches to a subset of the InterPro databases). A full description of the steps, tools and reference libraries used is provided on the EMG website at https://www.ebi.ac.uk/metagenomics/pipelines/2.0.

