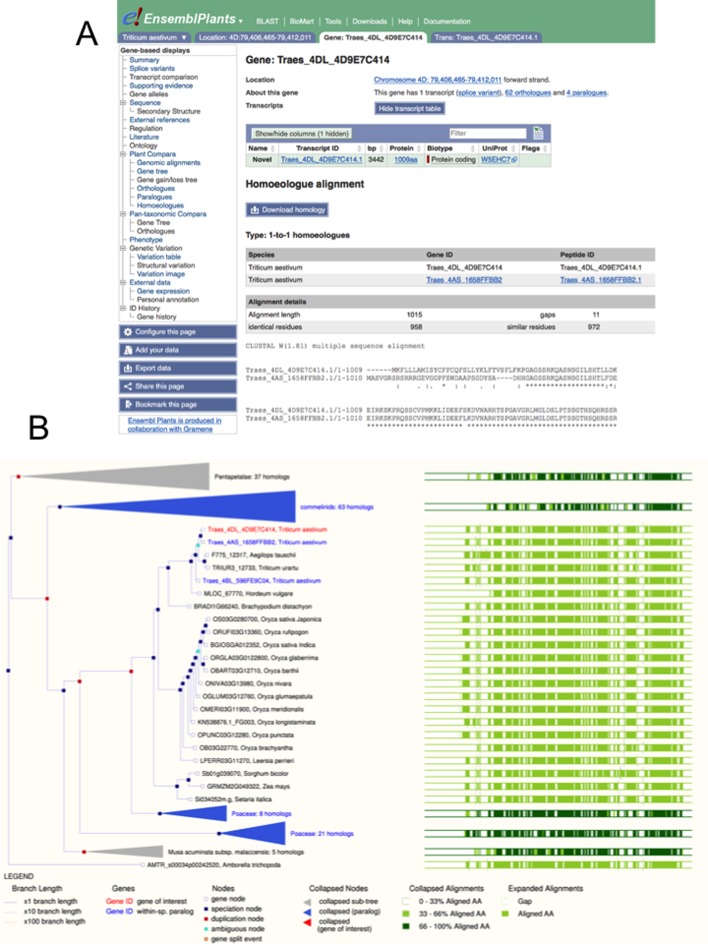
Figure 1.
Comparative genomics of bread wheat, as visualized in Ensembl Plants. Panel A shows the alignments of two homoeologous genes at the level of protein sequence. The selected gene is highlighted in red. Panel B shows these genes in the wider context of a gene tree, showing 1:1 orthology over 21 grass genomes including the 3 bread wheat genomes and the two sequenced diploid precursors.

