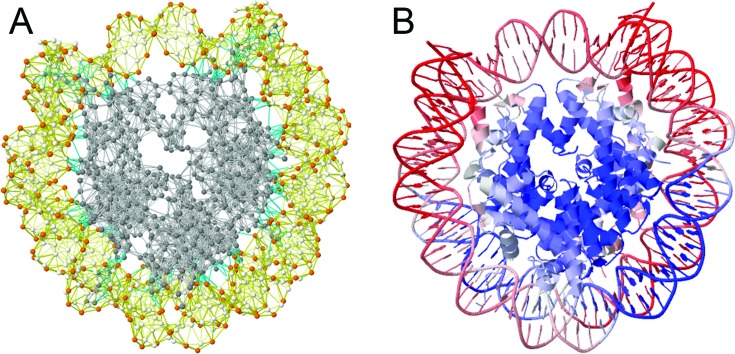
Figure 1.
GNM representation of biomolecular structures and color-coded ribbon diagrams used in the iGNM DB, illustrated for the nucleosome core particle (PDB id: 1KX4). (A) The GNM representation consists of a series of nodes located at the positions of the Cα-atoms (gray) for proteins, and at the P (orange), C4‘- and C2-atoms (white) for DNA/RNA. The nodes are connected by elastic springs, shown by light-gray (intramolecular, protein), yellow (intramolecular, DNA/RNA) or cyan (intermolecular) lines. (B) Ribbon diagram of the same structure, color-coded by residue square-fluctuations in the softest two modes computed by the GNM analysis. The colors vary from red (most mobile) to blue (most rigid).

