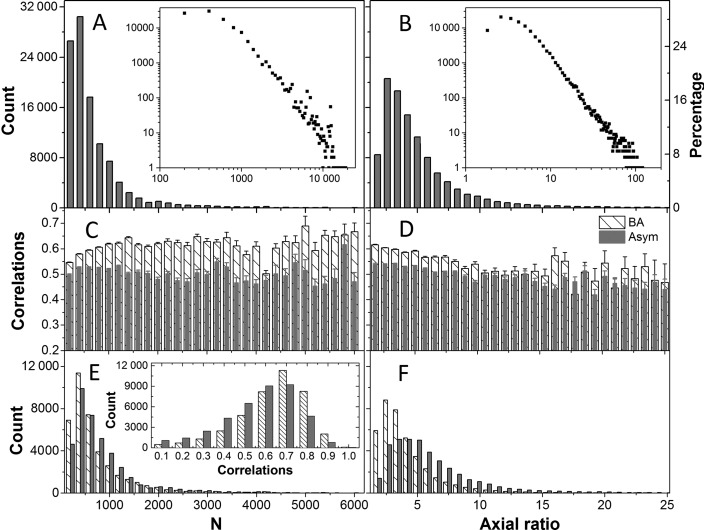
Figure 2.
Distributions of the sizes and shapes of PDB structures in the iGNM 2.0 and correlation between experimental and theoretical mean-square fluctuation profiles. (A) Size distribution in terms of N, the number of nodes. For proteins, N is equal to the number of amino acids, for RNA/DNA it is 3 x number of nucleotides, each nucleotide being represented by three nodes. The size of the structures in the GNM DB varies in the range 12 ≤ N ≤ 20 872. The left and right ordinates display the count and percentage, respectively, based on bins of ΔN = 200. The logarithmic plot in the inset permits to view the distribution of larger structures. 13.9% of the structures in the iGNM 2.0 (14 899 out of 107 201) contain >103 nodes. (B) The distribution of axial ratios, a. The counts (left ordinate) and percentages (right ordinate) refer to bins of size Δa = 0.8, starting from a = 1. Some of the structures are highly asymmetric (axial ratio ∼100). (C–F) Results for 39 505 PDB structures whose biological assembly (BA) is different from default structure reported in the PDBs (asymmetric unit, Asym). Panels (C) and (D) display the correlation coefficients (and their standard errors, shown by the error bars) between experimentally observed and GNM-predicted ms fluctuations, for the default PDB coordinates (gray bars) and the corresponding BAs (dashed bars), as a function of the size N (C) and axial ratio a (D) of the structures. Experimental data are based on the X-ray crystallographic B factors. Panels E and F display the corresponding counts, and the inset in E gives the distribution of correlations. A considerable increase in the level of agreement with experiments is achieved upon performing the analysis for the BA, rather than the default PDB file.

