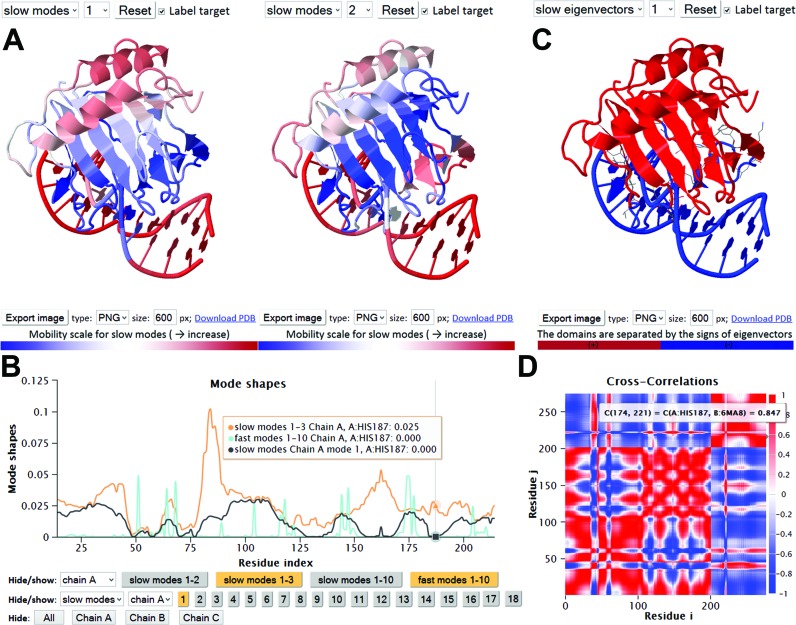
Figure 3.
Results from iGNM 2.0 for DNA/AlkB family demethylase complex. Panel A displays the color-coded ribbon diagrams, from red (most mobile) to blue (most rigid) in the selected modes, rendered using JSmol. Panel B shows the shapes of selected modes (colored orange in the keys underneath) for chain A (demethylase): softest mode (slow mode 1, black), cumulative contribution of slow modes 1–3 (orange) and fastest 10 modes (cyan). Minima in the slow modes refer to key mechanical or chemical sites such as the hinge sites or the catalytic sites. These are held in place during the collective motions of the remaining parts. In this case, H187 is a catalytic residue. Peaks in the fast modes refer to centers of energy localization. (C) Domain separation obtained by mode 1. This mode separates the enzyme and DNA molecules indicating that the two molecules undergo anticorrelated motions in this most cooperative mode. (D) Orientational cross-correlations, associated with the slowest three modes. Red regions refer to residue pairs that move in the same direction (Cijorient > 0); blue regions refer to the pairs moving in opposite directions (Cijorient < 0), and uncorrelated pairs are shown in white (color-code bar on the right). Residue numbers along the axes refer to those of all chains ordered by chain index. Here, chains B and C are the two DNA strands, each of length 13, and chain A is the enzyme of 214 residues.

