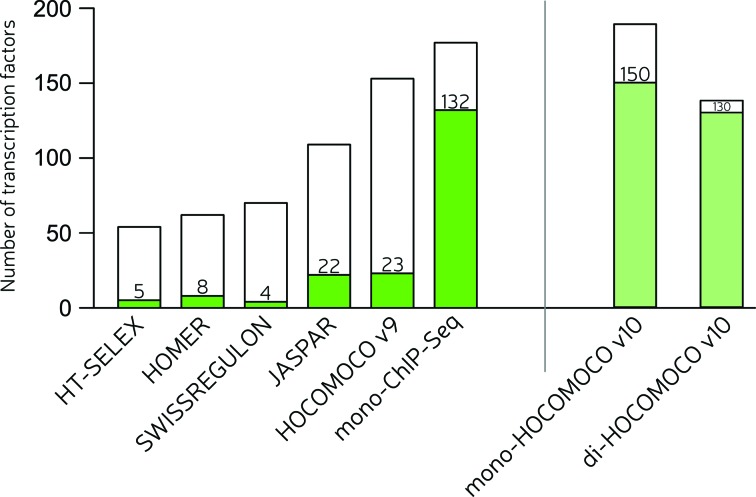
Figure 2.
Results of the benchmark assessing performance of different model collections on human and mouse ChIP-Seq data. The full height of each bar depicts the total number of assessed TFs for a particular case. The green fraction of a bar depicts the number of TFs for which a model from the given collection was the best (had the highest wAUC). The white fraction of the mono-HOCOMOCO v10 bar consists of TFs with the best models found in the databases that did not participate in the collection assembly (HOMER, SWISSREGULON, JASPAR and the published version of HT-SELEX).

