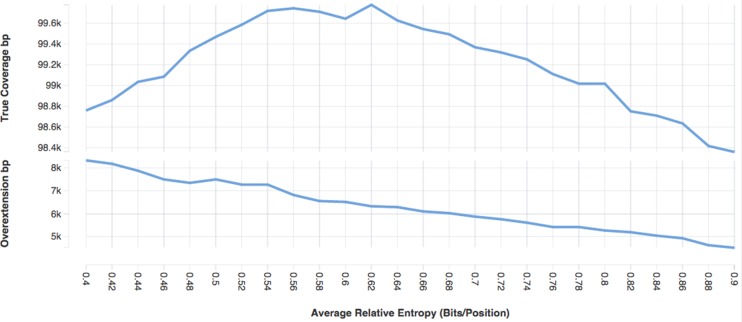
Figure 1.
Influence of average relative entropy on annotation for one family. This plot shows the impact of target average relative entropy values of the Charlie15a (DF0000089) model on both annotation coverage (true positives) and overextension. Using the Charlie15a seed, profile HMMs were built with HMMER's hmmbuild tool, with varying target average relative entropy values ranging from 0.4 to 0.9 bits per position, using the - -ere flag. The largest of these values represents the average relative entropy of the model when no sequence downweighting (entropy weighting) is performed. Coverage was assessed by searching each entropy-weighted profile HMM against the human genome. Overextension was assessed by searching each profile against a simulated genome containing fragments of true Charlie15a elements planted into realistic simulated genomic sequence built using GARLIC.

