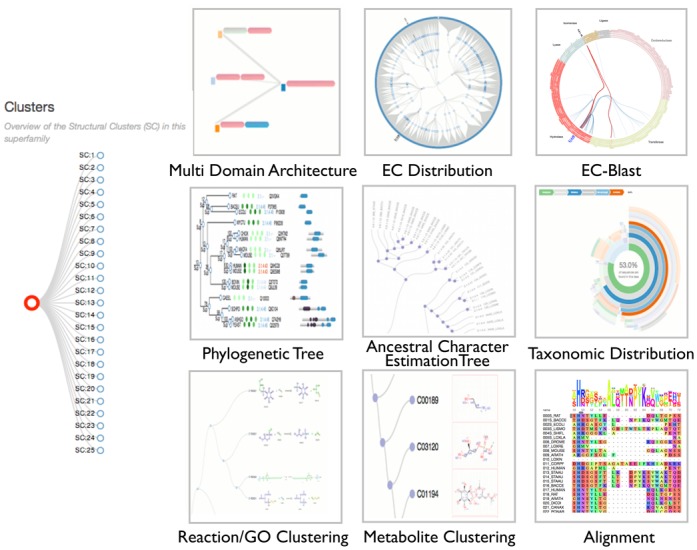
Figure 5.

An overview of the tiles presented within FunTree that link to the various data visualizations. At the superfamily level, the multi-domain architectures, EC-distribution and EC-Blast results are available. At the SSG level the phylogenetic tree, ancestral character estimations, taxonomic distribution, functional clustering tree and alignments are available. On the left, the interactive browser to move between superfamily and SSG levels.
