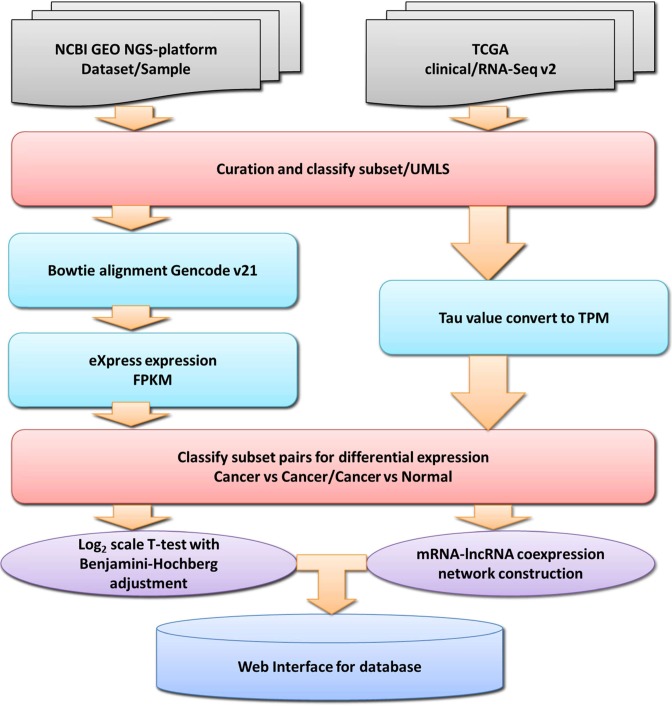
Figure 1.
Framework for constructing the CRN database. Cancer RNA-Seq data sets were collected from NCBI GEO, SRA and TCGA, and then all samples were classified into the phenotype-specific subsets. For the GEO data sets, Bowtie2 and eXpress software were used to calculate isoform expressions using GENCODE v21 as a reference. For the TCGA data sets, we converted the expression values (tau values) of the TCGA Level 3 RNA-Seq version 2 data sets to TPM (transcripts per million). To identify phenotype-specific differentially expressed protein-coding transcripts and lncRNAs in each data set, we performed log2 scale t-tests with Benjamini–Hochberg adjustment between each pair of subsets with no overlapping samples and from the same data set. For each subset pair, we selected coding transcripts and lncRNAs with high expression variance, then calculated the correlations of expression profiles between selected coding transcripts and lncRNAs to construct an mRNA–lncRNA coexpression network.

