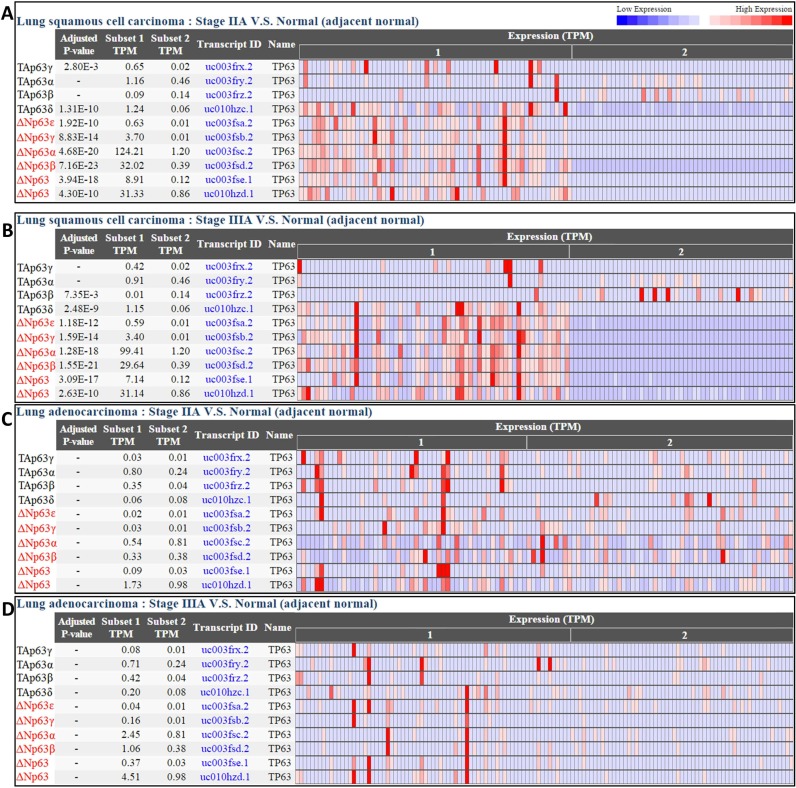
Figure 3.
The differential expressions of two TP63 major isoform groups ‘TAp63 and ΔNp63’ in lung squamous cell carcinoma (A, B) and lung adenocarcinoma (C, D). Based on the adjusted P-values calculated by CRN, ΔNp63 isoforms are significantly overexpressed with respect to normal tissue in lung squamous cell carcinoma, but not in lung adenocarcinoma. In contrast, TAp63 has low expression in all four subset pairs. In the adjusted P-value column, the absent values indicate insignificance (adjusted P-value > 0.01) in differential expression analysis.

