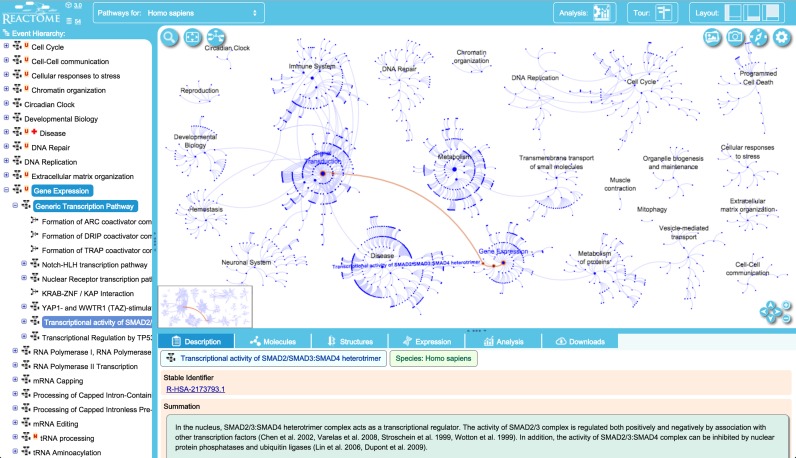
Figure 3.
Pathway browser view centred on the ‘gene expression’ top-level pathway. Access to subpathways is provided via the hierarchical display of events on the left and by clicking on event nodes in the pathway display (viewport). Details for the selected event are shown in the panel under the pathway display. Buttons at the right of the top bar show the current version of our software (3.0) with access to our Github software repository, and the current version of our data (release 54). A button in the top bar provide access to the analysis tools (see below, Figure 4). Clicking on the layout buttons closes and re-opens the hierarchical display and details panels. The ‘tour’ button provides access to a brief video tour of the main features of the web site. Clicking on the gearwheel icon in the upper right corner of the pathway diagram provides access to a tool to customize diagram colouring and to an ‘About …’ pop-up that briefly describes pathway diagram features and contains a link to the detailed users’ guide. (This guide is also accessible via the ‘documentation’ drop-down menu at the top of the home page).

