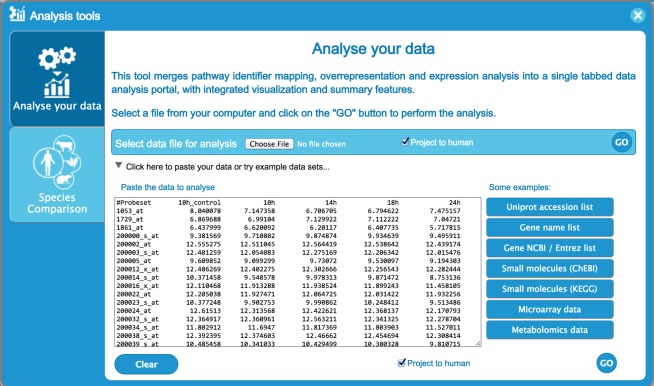
Figure 4.
Analysis tool user data submission interface, showing time-series data. Each row represents data for a different gene. Columns contain an identifier (probe set, gene name, etc.) on the left and expression values for four time points to the right, entered as tab-delimited text. UniProt identifiers, gene names and Affimetrix identifiers, among others, can be submitted. The ‘project to human’ box at the bottom of the form, which is selected by default, causes any non-human identifiers in the data to be replaced by their human equivalents and the latter to be used for the analysis. Instructions for formatting data and lists of acceptable identifiers are provided in the users’ guide (Figure 3).

