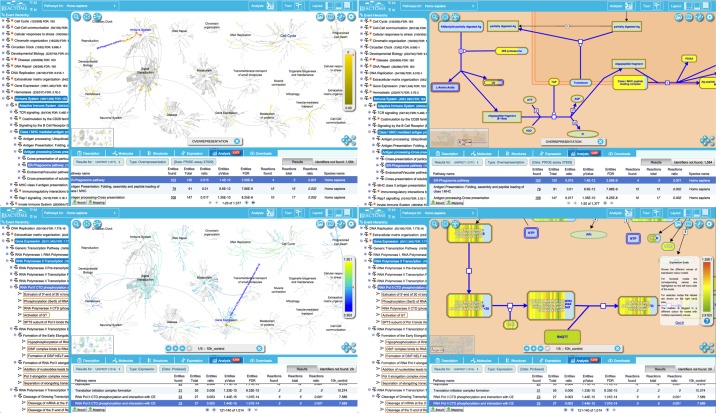
Figure 5.
Analysis results. Top panels, an analysis of a PRIDE dataset (assay 27 929—http://www.ebi.ac.uk/pride/ws/archive/protein/list/assay/27929.acc in project PXD000072—http://www.ebi.ac.uk/pride/archive/projects/PXD000072) to identify proteins over-expressed in activated human platelet releasate (5). Bottom panels, an expression analysis. Left panels show overlays on the pathways overview; right panels are an overlay of the data for a selected pathway on the pathway diagram. The details panel at the bottom lists results and statistics for each pathway, including numbers of identifiers in the submitted dataset that did not match anything in the Reactome dataset. A binomial test is used to calculate the probability shown for each result, and the P-values are corrected for the multiple testing (Benjamini–Hochberg procedure) that arises from evaluating the submitted list of identifiers against every pathway.

