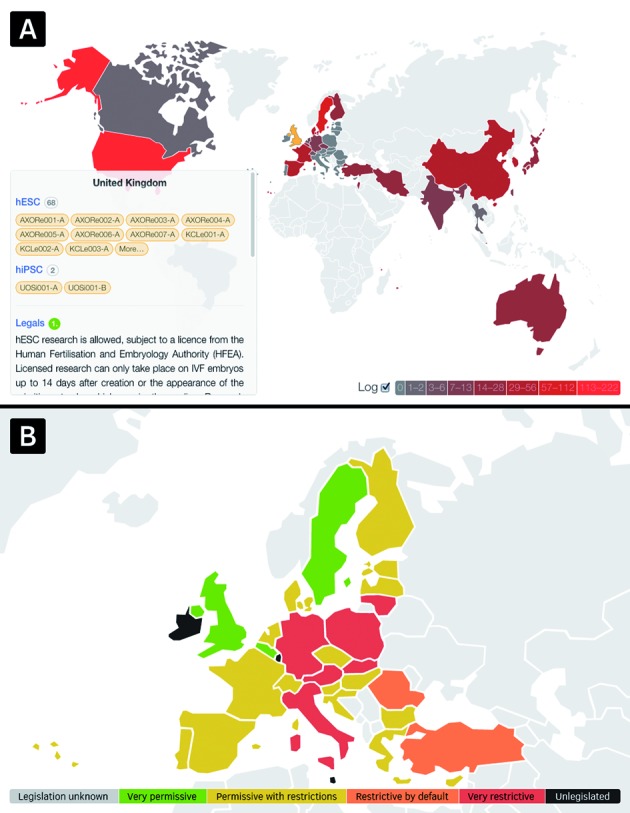
Figure 2.

Interactive world map. Exploration of the worldwide distribution of registered cell lines and country-wise legalization: (A) shows the world wide log-transformed distribution of registered hPSC lines in hPSCreg. Colors range from dark gray (least cell lines registered) to saturated red (most cell lines registered). Countries without any registered cell line are colored in light gray. Note that in the printed version of this article colors are shown in gray scale. (B) Shows a zoomed view of Europe, displaying legal information by a five-grade color system. The coloring is an approximation of the exact legal state. More details are available on the country specific pages which are linked to the map.
