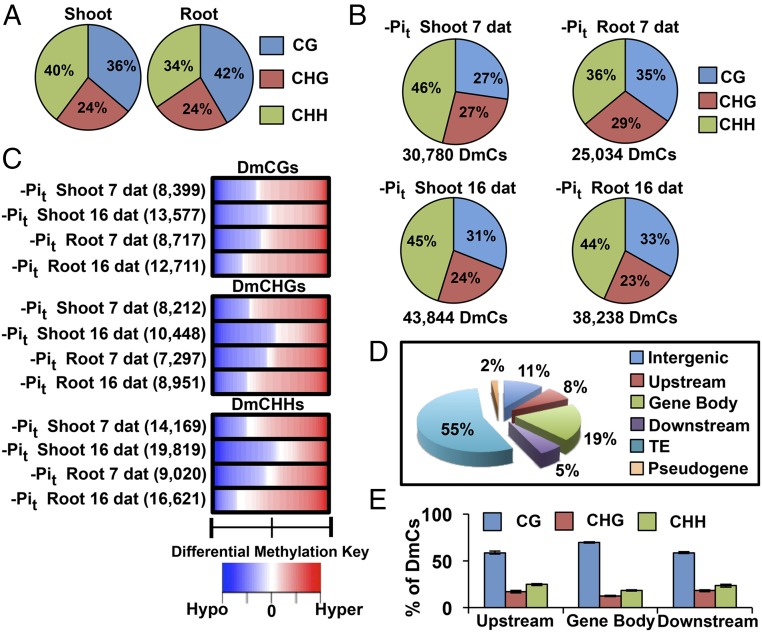
Fig. 3.
Differential methylation of DNA in response to Pi starvation. (A) Context breakdown for non-DmCs in root and shoot methylomes; values are the mean percentages of non-DmCs in all root and shoot libraries. (B) Total number of DmCs and sequence context breakdown of DmCs in response to phosphate starvation. (C) DNA methylation direction, number of DmCs, degree of differential methylation, and breakdown by context for each phosphate treatment [Hypo, hypomethylation (blue); Hyper, hypermethylation (red)]. (D) DmCs mapped to different gene features: Transposable Element (TE), Intergenic, Pseudogene, Upstream (1,500 bp upstream of the transcription start site), Gene body (including 5′ and 3′ untranslated regions, exons, and introns), and Downstream (1,500 bp downstream of the polyadenylation site) according to the TAIR10 genome annotations. (E) Context breakdown of gene-related DmCs.

