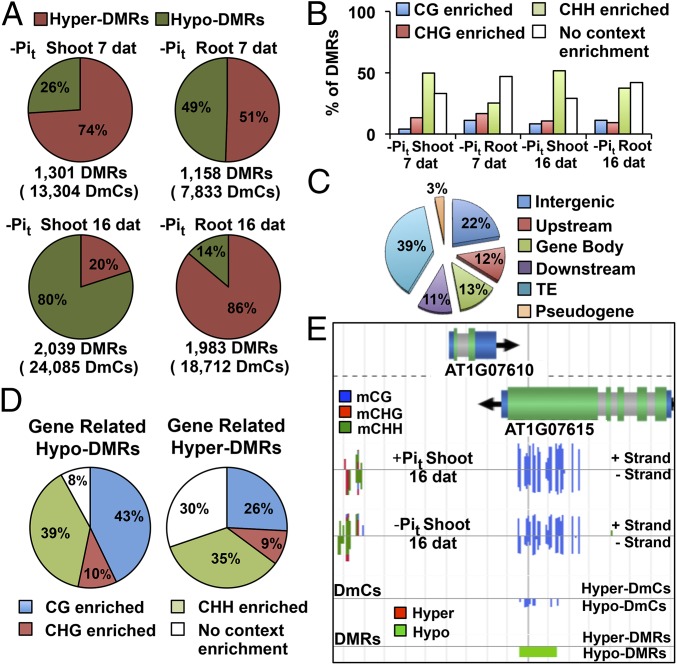
Fig. 4.
Global Analysis of DMRs. (A) Total number of DMRs, number of DmCs within DMRs, and distribution of hyper and hypo-DMRs. (B) Context enrichment of DMRs. (C) DMRs mapping to different genomic categories. (D) Context enrichment of gene-related DMRs. (E) Visualization of the methylation data (full-genome methylome profiling, DmCs, and DMRs) using the EPIC-CoGe Browser.

