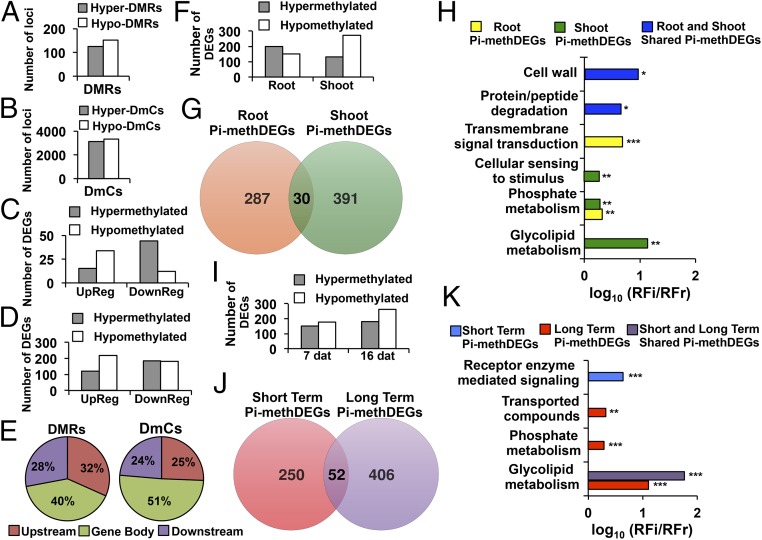
Fig. 5.
Spatiotemporal analysis of differentially methylated DEGs. (A) Number of loci affected by hyper- and hypo-DMRs mapping to genes in response to Pi starvation conditions. (B) Number of loci affected by hyper- and hypo-DmCs mapping to genes. (C) Number of loci affected by hyper- and hypo-DMRs mapping to genes that were differentially expressed (up-regulated, down-regulated). (D) Number of loci affected by hyper- and hypo-DmCs mapping to genes that were differentially expressed (up-regulated, down-regulated). (E) Cutoffs for the genomic regions carrying DMR DEGs and DmC DEGs. (F) Number of DEGs that were differentially methylated in gene regions in roots and shoots in response to Pi starvation conditions. (G) Venn diagram of unique and shared differentially methylated gene-related DEGs (Pi-methDEGs) between roots and shoots. (H) Gene ontology enrichment analysis of organ-specific or shared Pi-methDEGs between roots and shoots. Values represent the decimal logarithm of normalized frequency (relative frequency of the inquiry set/relative frequency of the reference set RFi/RFr), and the enrichment cutoff was twofold. P values are denoted by asterisks (*P < 0.05, **P < 0.01, ***P < 0.001). (I) The number of DEGs that were differentially methylated in gene regions in response to Pi starvation conditions during two different time periods. (J) Venn diagram of unique and shared Pi-methDEGs between short- and long-term exposure to Pi stress. (K) Gene ontology enrichment analysis of organ-specific or shared Pi-methDEGs between short- and long-term Pi starvation. Values represent the decimal logarithm of normalized frequency (relative frequency of the inquiry set/relative frequency of the reference set RFi/RFr), and the enrichment cutoff was twofold. P values are denoted by asterisks (**P < 0.01, ***P < 0.001).

