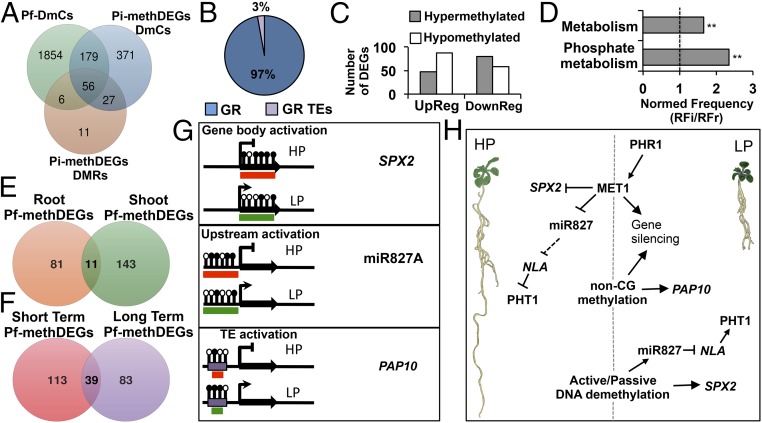
Fig. 7.
Pf-DmCs and their association with the expression of PSR genes. (A) Venn diagram of the Pf-DmCs that were shared with the set of Pi-methDEGs DmCs and of Pi-methDEGs DMRs. (B) Percentage breakdown of gene-related DmCs and GR TEs DmCs within Pf-mehDEGs. (C) Number of DEGs containing Pf-DmCs (Pf-methDEGs). (D) Gene ontology enrichment analysis of Pf-methDEGs. Values represent the normalized frequency (relative frequency of the inquiry set/relative frequency of the reference set RFi/RFr). The enrichment cutoff was twofold, and P values are denoted by asterisks (**P < 0.01). (E) Venn diagram of unique and shared Pf-methDEGs between roots and shoots. (F) Venn diagram of unique and shared Pf-methDEGs between short- and long-term analyses. (G) Methylation statuses associated with changes in gene expression among the most representative PSR genes in response to LP. Black lollipops depict hypermethylated cytosine positions, whereas blank lollipops represent hypomethylated cytosine positions. The red boxes indicate inactive transcriptional states, and the green boxes denote an active transcriptional state. (H) General model of DNA methylation modulation of PSR genes under HP and LP conditions: under high Pi conditions, MET1 and to a minor extent non-CG methyltransferases contribute to the establishment of silencing methylation states of PSR genes. By contrast, under low Pi conditions, a set of Pi-starvation–responsive genes is activated via the key regulator PHR1 including MET1 and possibly another DNA methyltransferase. MET1 and non-CG methyltransferases in turn target a specific group of PSR genes for silencing. Finally, passive or active demethylation releases the silencing control over HP-hypermethylated PSR genes.

