Fig. 3.
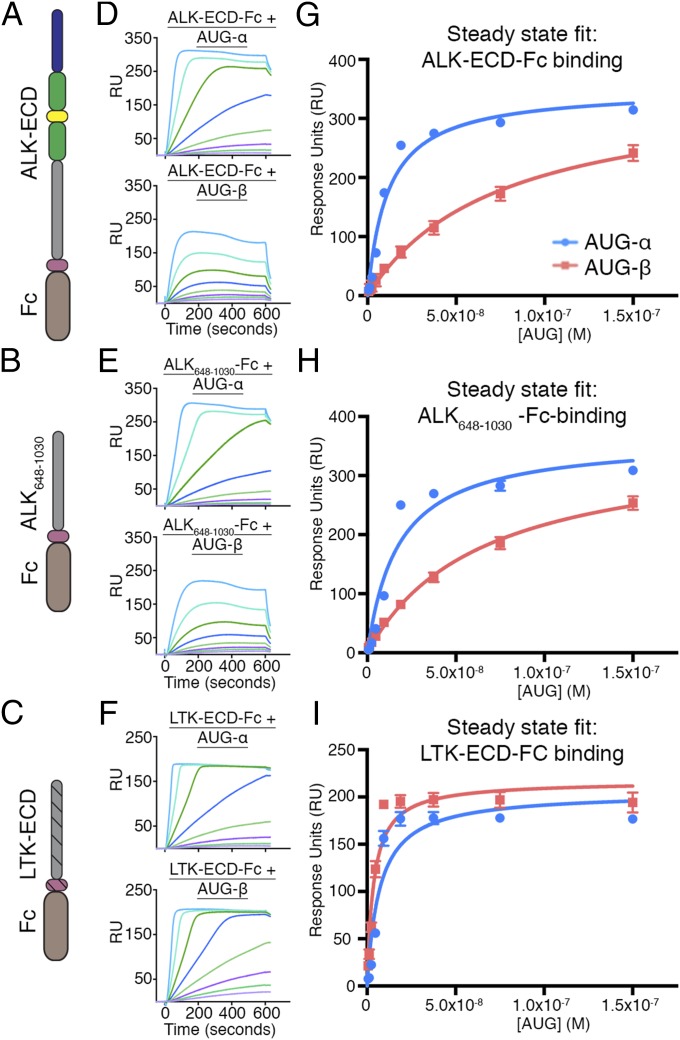
SPR binding analysis of AUG-α and AUG-β to FC-fusion receptors immobilized on a protein A chip. (A–C) Schematic representation of the domain organization of the ALK-ECD, ALK648–1,030, and LTK-ECD. (D–F) SPR sensograms for binding of AUG-α and AUG-β to immobilized receptors. (D) Binding of AUG-α (Top) and AUG-β (Bottom) to the ALK-ECD surface. (E) Binding of AUG-α (Top) and AUG-β (Bottom) to the ALK648-1,030 surface. (F) Binding of AUG-α (Top) and AUG-β (Bottom) to the LTK-ECD surface. (G–I) Fitting of receptor–augmentor affinity, using the steady-state 1:1 binding model. AUG-α binding is blue, and AUG-β binding is red. (G) For ALK-ECD, the KD for AUG-α binding is 11.4 ± 1.7 nM, and the KD for AUG-β binding is 74.3 ± 9.5 nM. (H) For ALK648–1,030, the KD for AUG-α binding is 17.4 ± 3.9 nM, and the KD for AUG-β binding is 64.0 ± 5.9 nM. (I) For LTK-ECD, the KD for AUG-α binding is 7.1 ± 1.8 nM, and the KD for AUG-β binding is 3.7 ± 0.7 nM.

