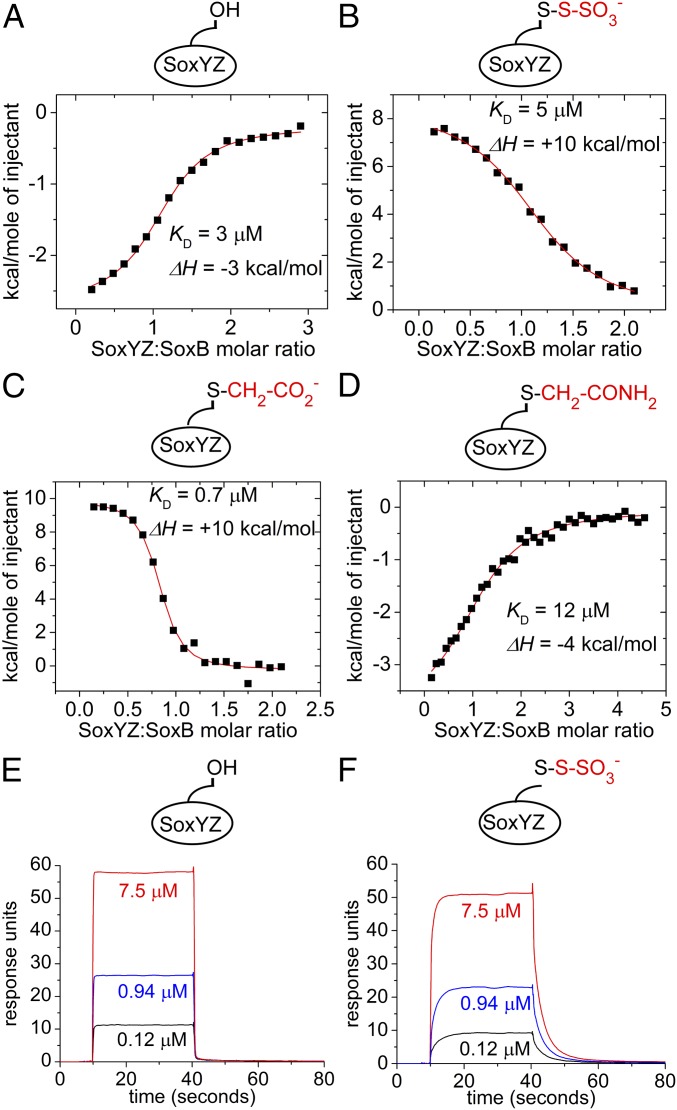
Fig. 4.
Biophysical analysis of the interaction between SoxYZ and SoxB. (A–D) Isothermal calorimetry experiments. In each case, integrated heats from a representative experiment are shown. The fit to the data and corresponding KD and enthalpy change values are from duplicate experiments. Experiments differ in the derivatization of the SoxY carrier arm cysteine residue as shown schematically by the cartoon in each graph. (A) SoxYC151SZ titrated into 47 μM SoxB. (B) SoxY(SSO3−)Z titrated into 50 μM SoxB. (C) SoxY(Ac)Z titrated into 50 μM SoxB. (D) SoxY(Am)Z titrated into 58 μM SoxB. (E and F) Representative surface plasmon resonance sensograms showing the kinetics of the association and dissociation of SoxYC151SZ (E) or SoxY(SSO3−)Z (F) to a SoxB-coated sensor chip. The concentrations of injected SoxYZ samples are indicated.

