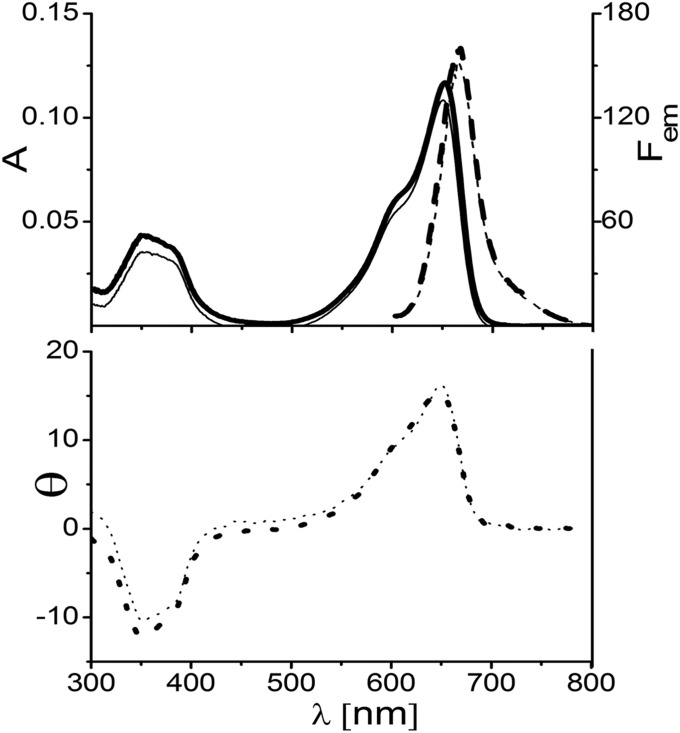
Fig. 1.
Absorption (A, solid line), fluorescence (Fem, dashed line) (Top), and CD (θ, dotted line) (Bottom) spectra of ApcEΔ, which are similar to the respective spectra of the variants of ApcE(1–240/Δ77–153) (Table S2). Samples were reconstituted in E. coli (Table S5), purified by Ni2+ affinity chromatography, and then dialyzed against potassium phosphate buffer (KPB; 20 mM, 0.15 M NaCl, pH 7.2) containing 0 M (thick lines) and 4 M (thin lines) urea. Emission spectra were obtained by excitation at 580 nm.

