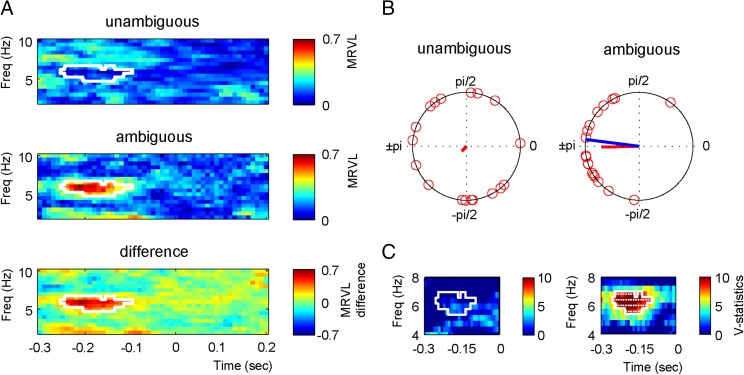
Fig. 2.
Prestimulus phase differences. (A) The mean resultant vector length across participants for the phase difference between /da/ and /ga/ for unambiguous sounds and for the phase difference between perceived /da/ and /ga/ for ambiguous sounds. The white outlines indicate the region of significant differences. (B) Phase differences of individual participants at 6 Hz at −0.18 s for unambiguous and ambiguous sounds. The blue line indicates the 80-ms expected difference. The red lines indicate the strength of the MRVL. (C) V statistics testing whether the phase differences are significantly nonuniformly distributed around 80 ms for all significant points in the MRVL analysis. The white outlines indicate at which time and frequency point the analysis was performed (note the difference in the x and y axes between A and C). White dots indicate significance.

