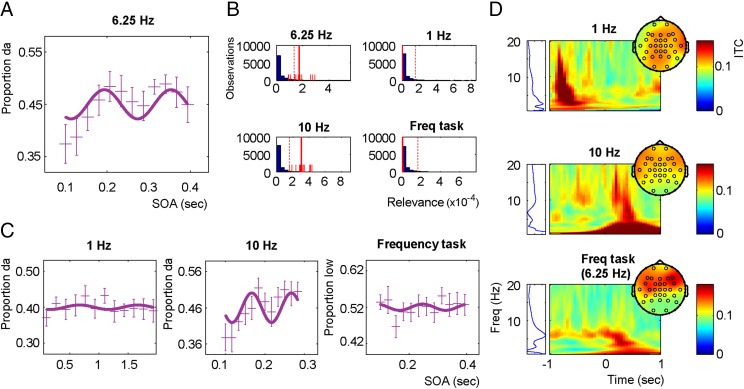
Fig. 3.
Results from experiment 2. (A) Grand average proportion of /da/ of all of the participants, with the respective error bars reflecting the within-subject SEM (plusses; vertical extension reflects the error bars) and the fitted 6.25-Hz sinus (solid line). (B) Bootstrap histograms for the relevance statistics for all four conditions. The long solid and dotted red lines represent the relevance value of that dataset and the 95 percentile of all bootstrapped values, respectively. The short solid lines indicate the 12 relevance values when iteratively taking out one participant. The blue bars represent the individual relevance values of all the different bootstraps. (C) The grand average of all participants, with the respective error bars reflecting the within-subject SEM (plusses; vertical extension reflects the error bars) for the three different control conditions used in the experiment and their respective best-fitted sinus (solid line). (D) Intertrial coherence (ITC) plots for all three entrainment frequencies. Zero indicates entrainment offset. (Left) The ITC averaged in the −0.5 to 0 interval (ITC range 0.08–0.12). All of the conditions show a peak at the respective entrainment frequency. However, for 1 Hz, an evoked response of the last entrainment stimulus is present (around −0.8 s). For 10 Hz, and to a lesser extent for 6.25 Hz, evoked responses to the target stimuli are present poststimulus (around 0–1 s). This effect only arises in these frequencies, because the interval target presented is much narrower than for 1 Hz.

