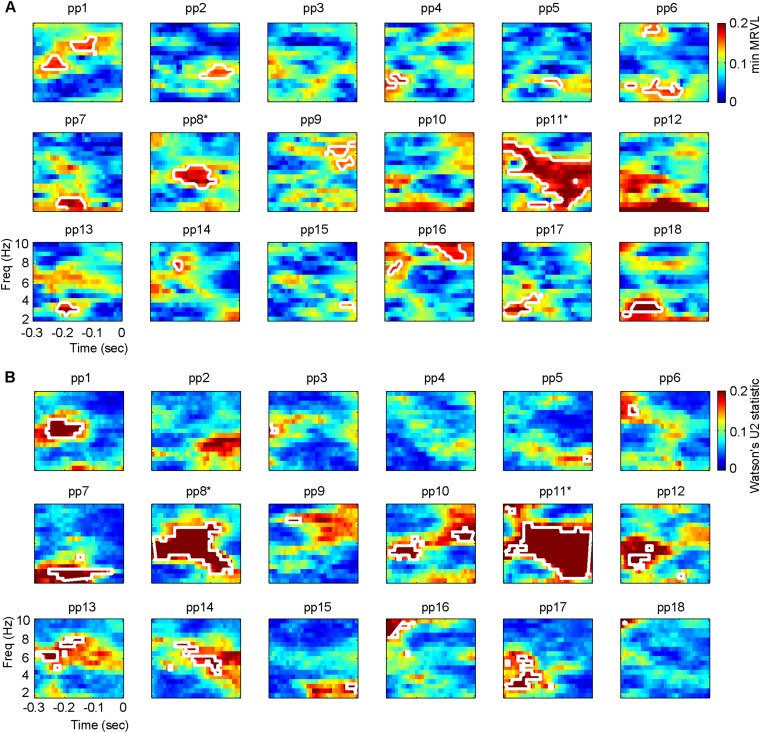
Fig. S2.
Single-subject analysis. (A) For each participant, the lowest intertrial coherence of the two syllable types per time/frequency data point is displayed. The white outlines indicate areas of significant minimum ITC (uncorrected). (B) For each participant, Watson’s U2 statistics comparing the mean phase of /da/ and /ga/ is displayed. The white outlines indicate areas of a significant Watson’s U2 value (uncorrected). The asterisks indicate the participants for whom the effect survived cluster-based corrections for multiple comparisons.

