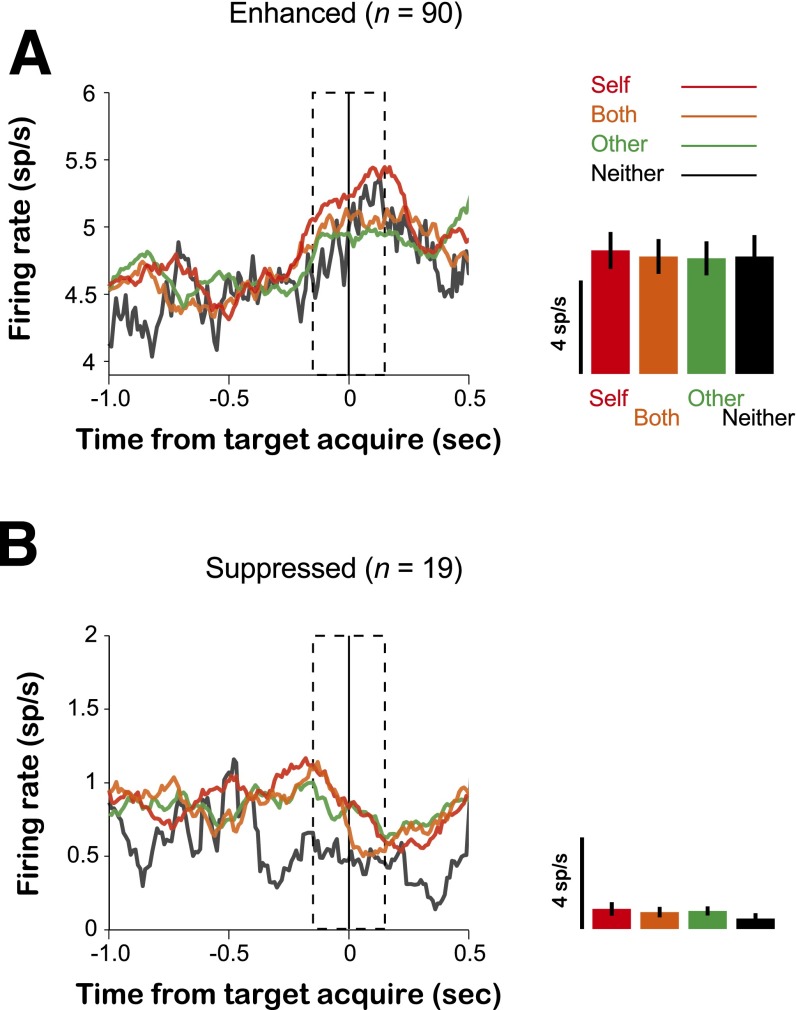
Fig. S5.
Population-averaged PSTHs are shown separately for the neurons that (A) enhanced (n = 90) and (B) suppressed (n = 19) firing rates around the time of each decision. We classified firing-rate modulations as enhanced if the changes in mean firing rates around the time of each decision exceeded at least 2× SEM relative to the 300-ms interval leading up the first fixation (baseline epoch). Similarly, we classified firing-rate modulations as suppressed if the changes in mean firing rates around the time of each decision diminished at least 2× SEM relative to the baseline. The dotted regions in the PSTHs indicate the epoch used to calculate firing rates around the time of decision. Bar graphs (Right) show the mean and SEM from these intervals. Red traces and bars: Self decision; orange: Both decision; green: Other decision; and black: Neither decision.

