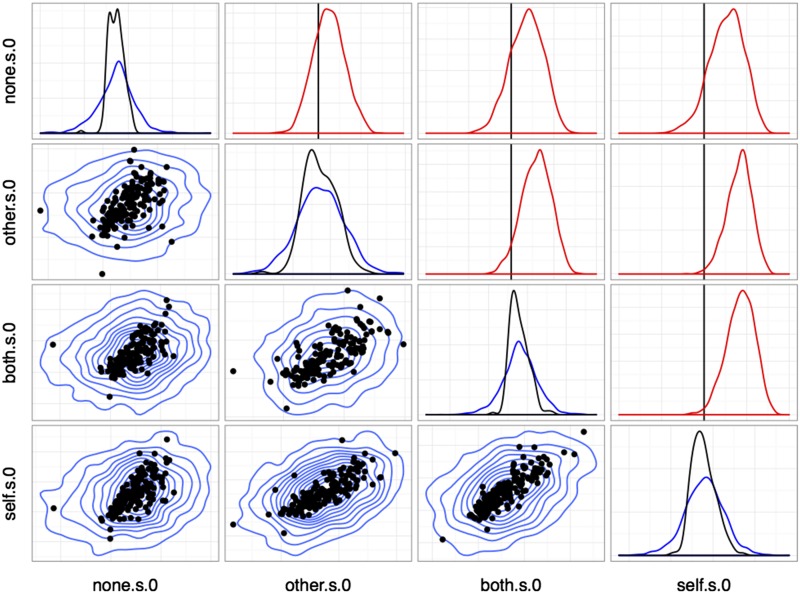
Fig. S7.
Correlations between reward sensitivities to distinct outcomes (choice). Plots in the lower triangle show point estimates for individual units (medians; black) and population posterior densities (blue) for pairs of regression effects. Diagonal plots show marginal densities for unit point estimates (black) and population (blue). Plots in the upper triangle show posterior densities for elements of the population correlation matrix between variables (red). The vertical line (black) marks correlation coefficient 0. Variable names take the form <outcome>[.s].<cue> with <outcome> the reward type, .s indicating a sensitivity parameter, and <cued ≥ 0 for choice trials and 1 for cued trials.

