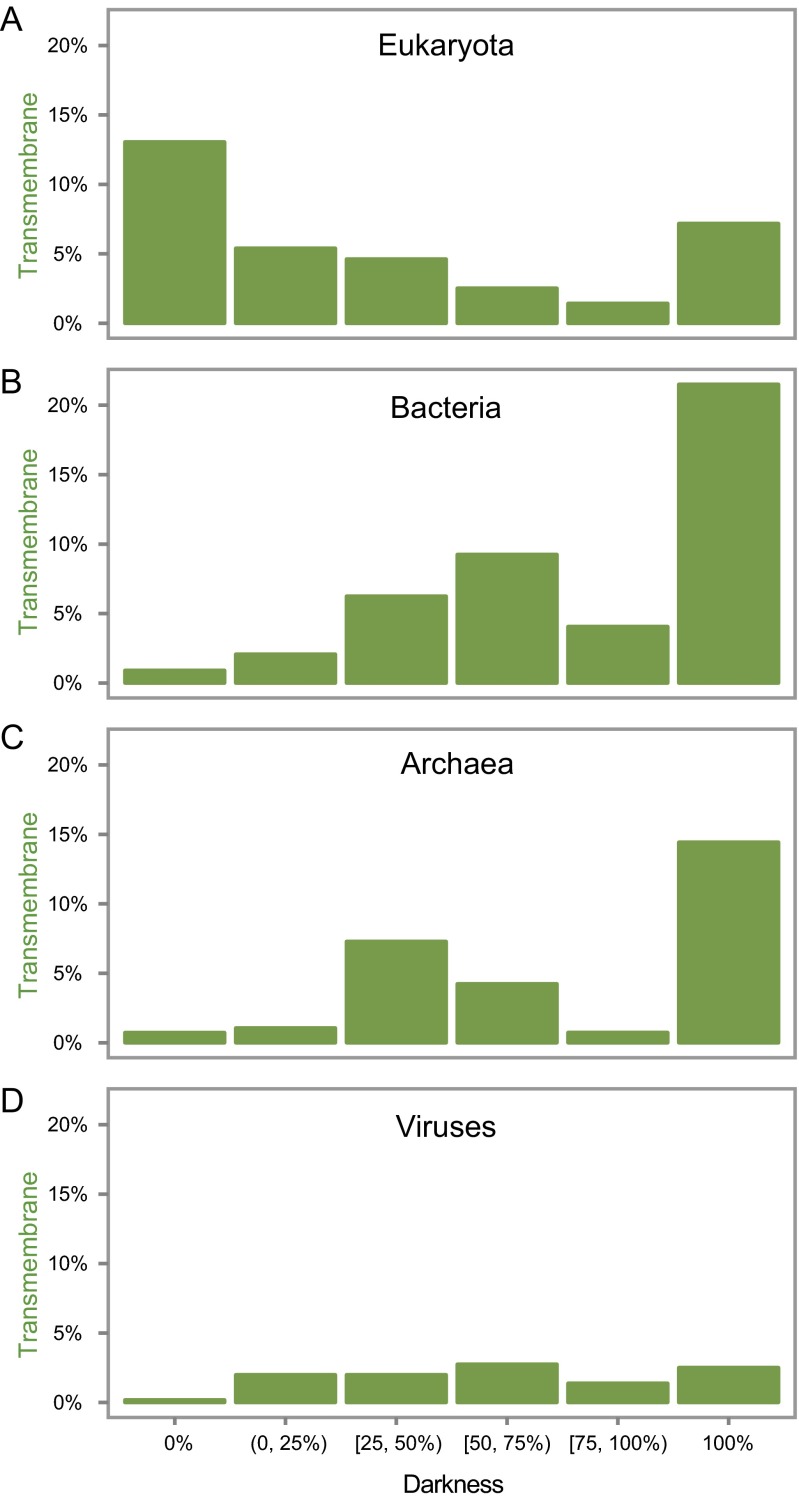
Fig. S5.
Transmembrane fraction vs. darkness. In each histogram, proteins have been binned into six groups according to their darkness score (darkness = 0%, 0% < darkness < 25%, 25% ≤ darkness < 50%, 50% ≤ darkness < 75%, 75% ≤ darkness < 100%, and darkness = 100%). We then calculated the average fraction of transmembrane residues across all proteins in each bin. (A) Surprisingly, for eukaryotic proteins, the largest fraction of transmembrane residues was seen for proteins with 0% darkness, and the fraction tended to decrease with increasing darkness, although rising somewhat for dark proteins (100% darkness). (B) Bacterial proteins show nearly the opposite behavior: the smallest fraction of transmembrane residues was seen for proteins with 0% darkness and the largest for proteins with 100% darkness. Interestingly, however, there was a dip in transmembrane fraction for proteins with 75% ≤ darkness < 100%. (C) Archaeal proteins show a similar overall pattern to bacteria: the transmembrane fraction tended to increase with increasing darkness, although there as a dip in transmembrane fraction for proteins with 50% ≤ darkness < 100%. (D) Overall, viral proteins have much lower transmembrane fraction and relatively little dependency on darkness.

