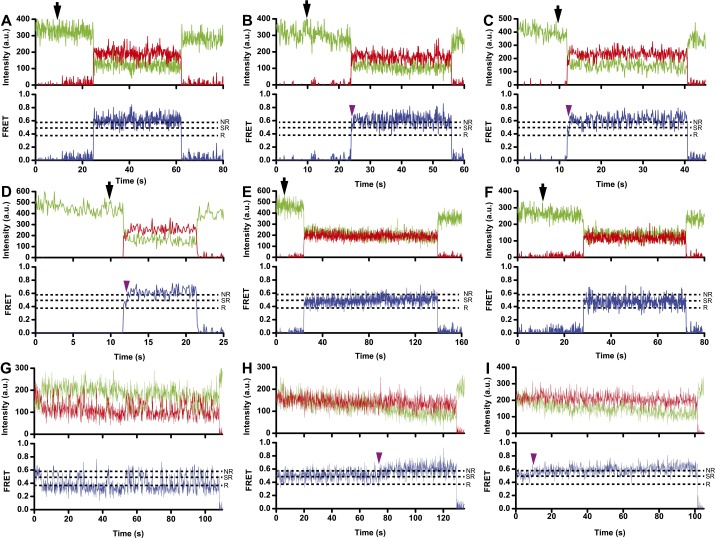
Fig. S3.
Sampling of the 0.5 FRET state in smFRET traces obtained using the S6/L9 FRET pair. (A–D) Exemplary smFRET traces showing the association of L9-Cy5 50S and S6-Cy3 30S in the presence fMet-tRNAfMet, IF1, IF2, IF3, and GTP. Traces B–D show transient sampling of 0.5 FRET. (E and F) Representative smFRET traces showing subunit joining in the presence of GDPCP, IF1, IF2, and IF3 (E) or GDPCP and IF2 alone (F). (G–I) Exemplary traces for preassociated 70S S6-Cy5/L9-Cy3 ribosomes containing a P-site aminoacylated fMet-tRNAfMet and incubated with 50 nM IF2 and 1 mM GDPCP. Trace G showing fluctuations between 0.4 and 0.6 FRET values likely correspond to the ribosomes that contain spontaneously deacylated tRNAfMet, which moves between classical P/P and hybrid P/E states (for comparison, please see a similar trace in Fig. S1A). Apparent transitions from 0.5 to 0.6 FRET in traces H and I likely correspond to dissociation of IF2•GDPCP from the 70S ribosomes containing fMet-tRNAfMet in the P site. Cy3 and Cy5 fluorescence intensities are in green and red, respectively, and apparent FRET is in blue. Black arrows indicate the time of L9-Cy5 50S injection; dark purple arrowheads, apparent transition from 0.5 to 0.6 FRET; dashed lines, FRET values corresponding to rotated (R), semirotated (SR), and nonrotated (NR) states. Cy3 photobleaching is not shown for presentation purposes.

