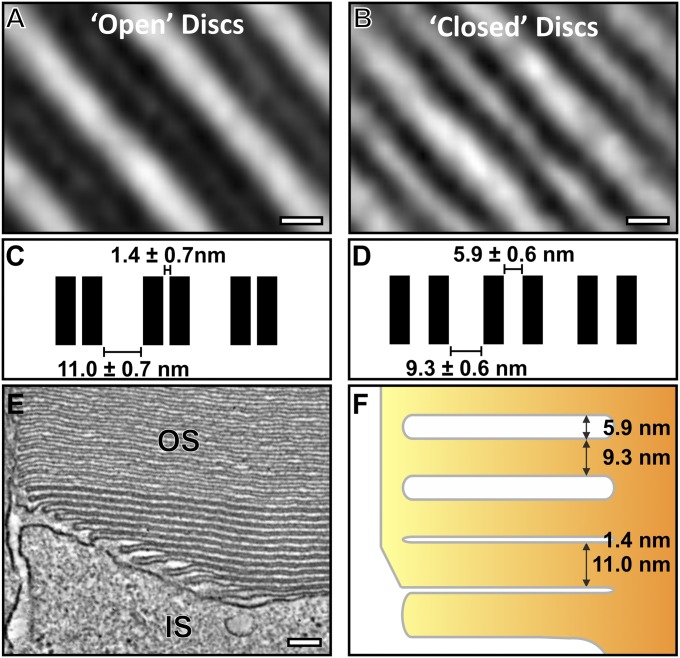
Fig. 5.
As discs mature, a change in the membrane spacing occurs. (A) Slice from subtomographic average of developing “open” discs and (B) mature “closed” discs. Note that the open discs appear electron dense because of the small luminal space. (C) Measurements of the disk membrane spacing in developing open and (D) mature closed discs. (E) A slice from the tomographic data showing the apparent difference in disk spacing between developing and mature discs. (F) A corresponding schematic diagram highlighting the change in disk spacing as the discs mature. (Scale bars, A and B, 5 nm; E, 100 nm.)

