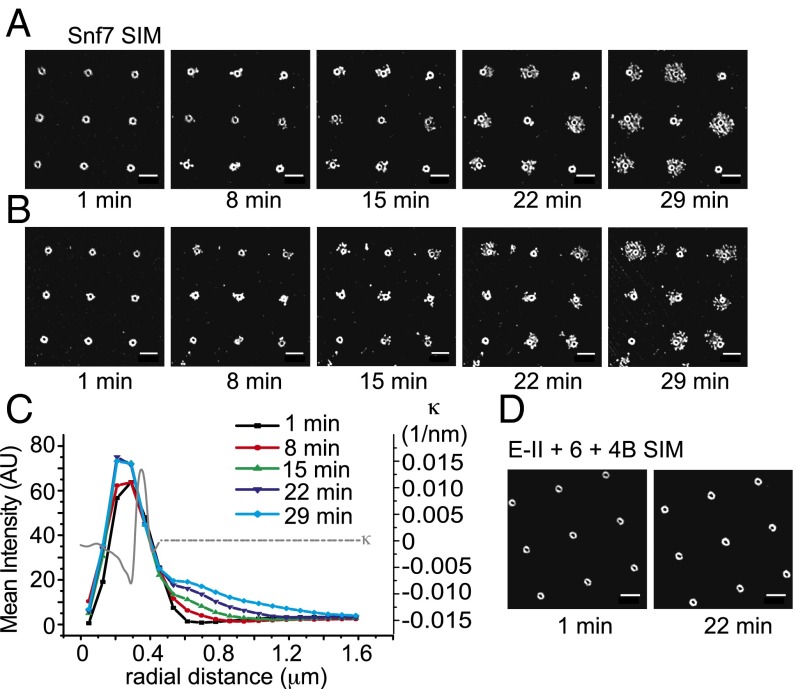
Fig. 6.
Superresolution imaging of Snf7 assembly. (A) A set of representative time lapse SIM images of Snf7 outgrowth at 5 µM concentration. Snf7 is recruited as an annular structure around the edge of the invagination, which is followed by branched outward growth. (B) Another set of time lapse images of the same reaction. Relatively rare events (<5%) showed inward growth toward the centers. The center right and center bottom invaginations show examples of inward growth. (C) SIM intensity was radially averaged for each time point to quantify radial extension of Snf7 over time. The radial distance is defined as the distance from the center of each invagination. SIM clearly resolves the annular intensity peak for initial recruitment, followed by outward extension. Curvature calculation on a representative morphology as was done in Fig. 1 is overlaid. It clearly shows that the nucleation is catalyzed by the lipid bilayer of negative curvature region. The 3D geometry of the invagination is radially symmetric and the curvature calculated represents general geometric factor of invSLB. (D) SIM images of the recruitment of CHMP4B-Atto488 at ESCRT-II 100nM, CHMP6 200nM, CHMP4B 400nM. Circular recruitment around each lipid invagination is clear and it does not experience any further change over time. (Scale bars, 2 µm.)

